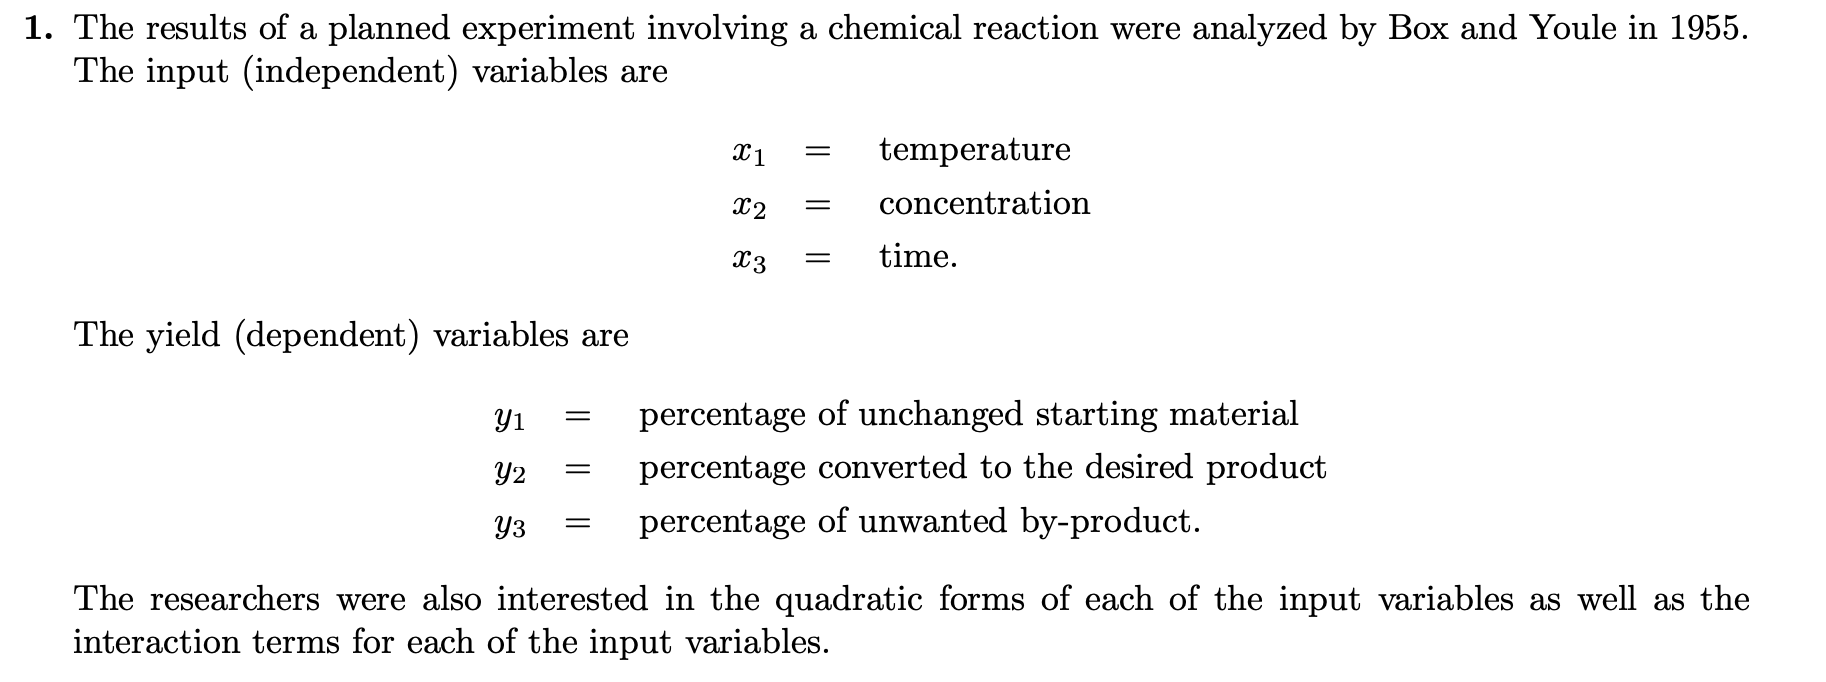
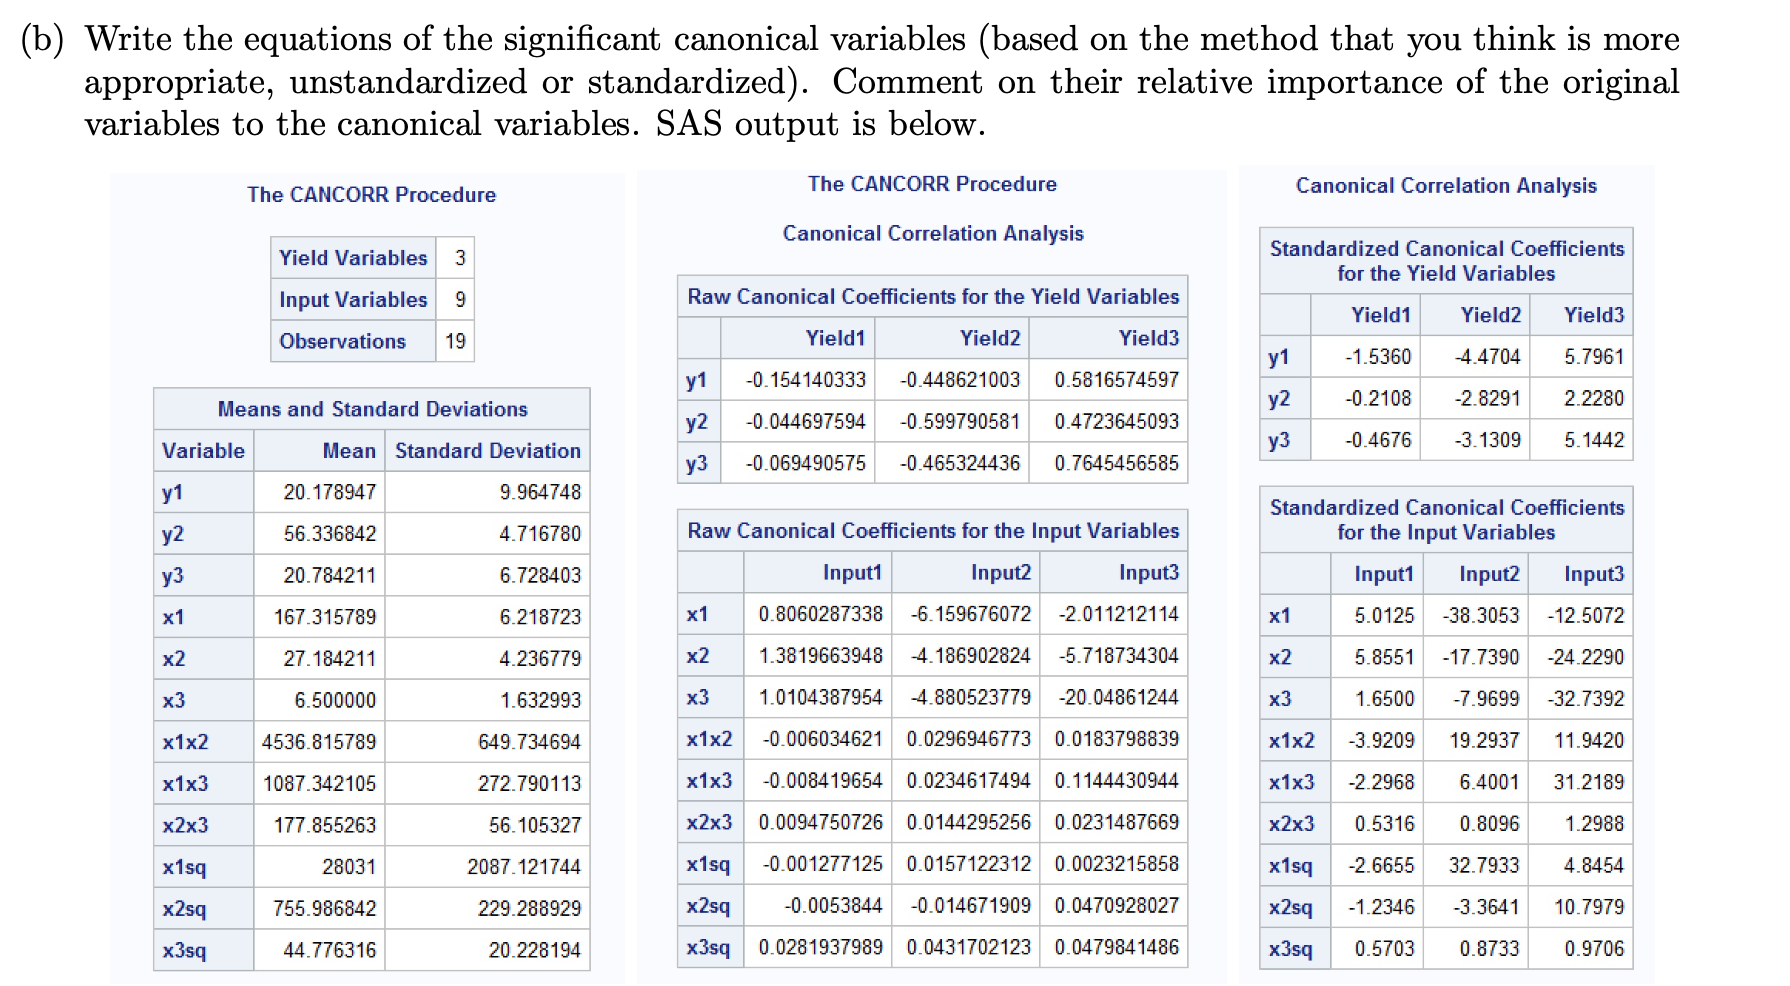
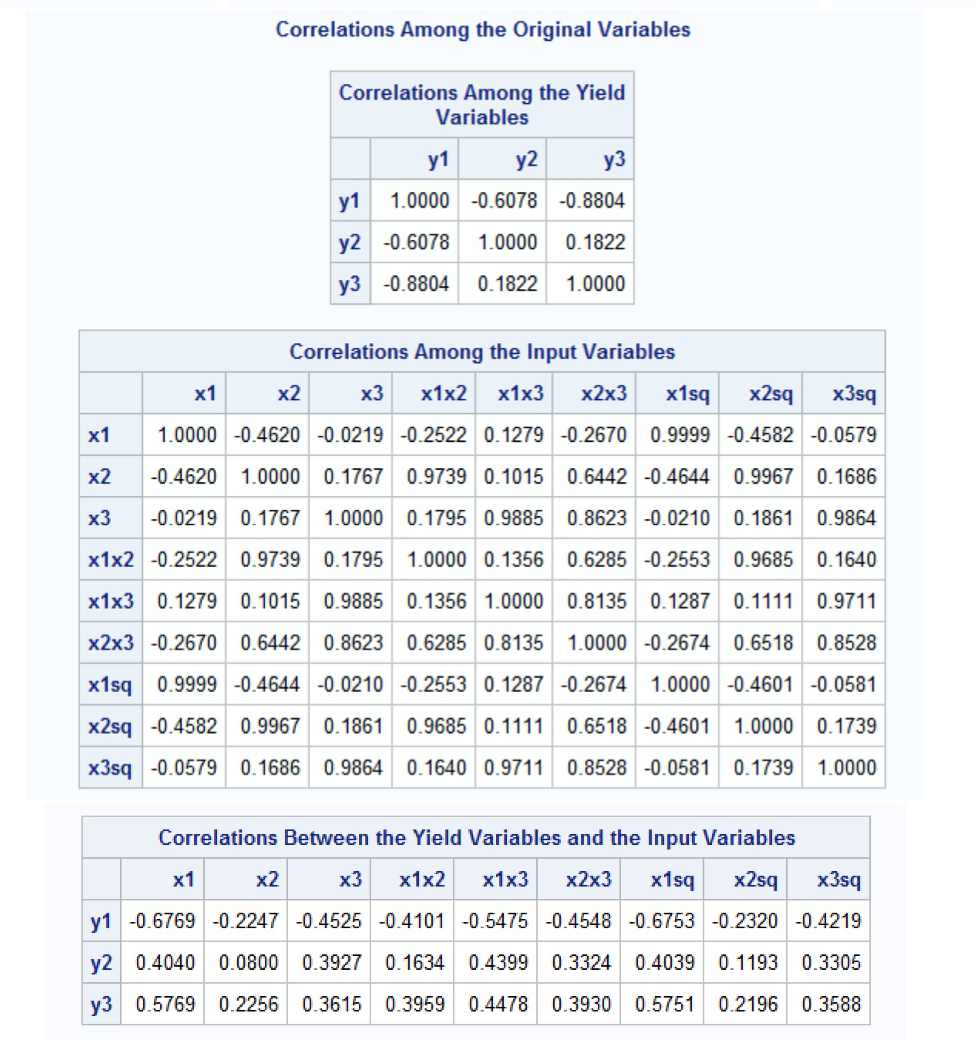
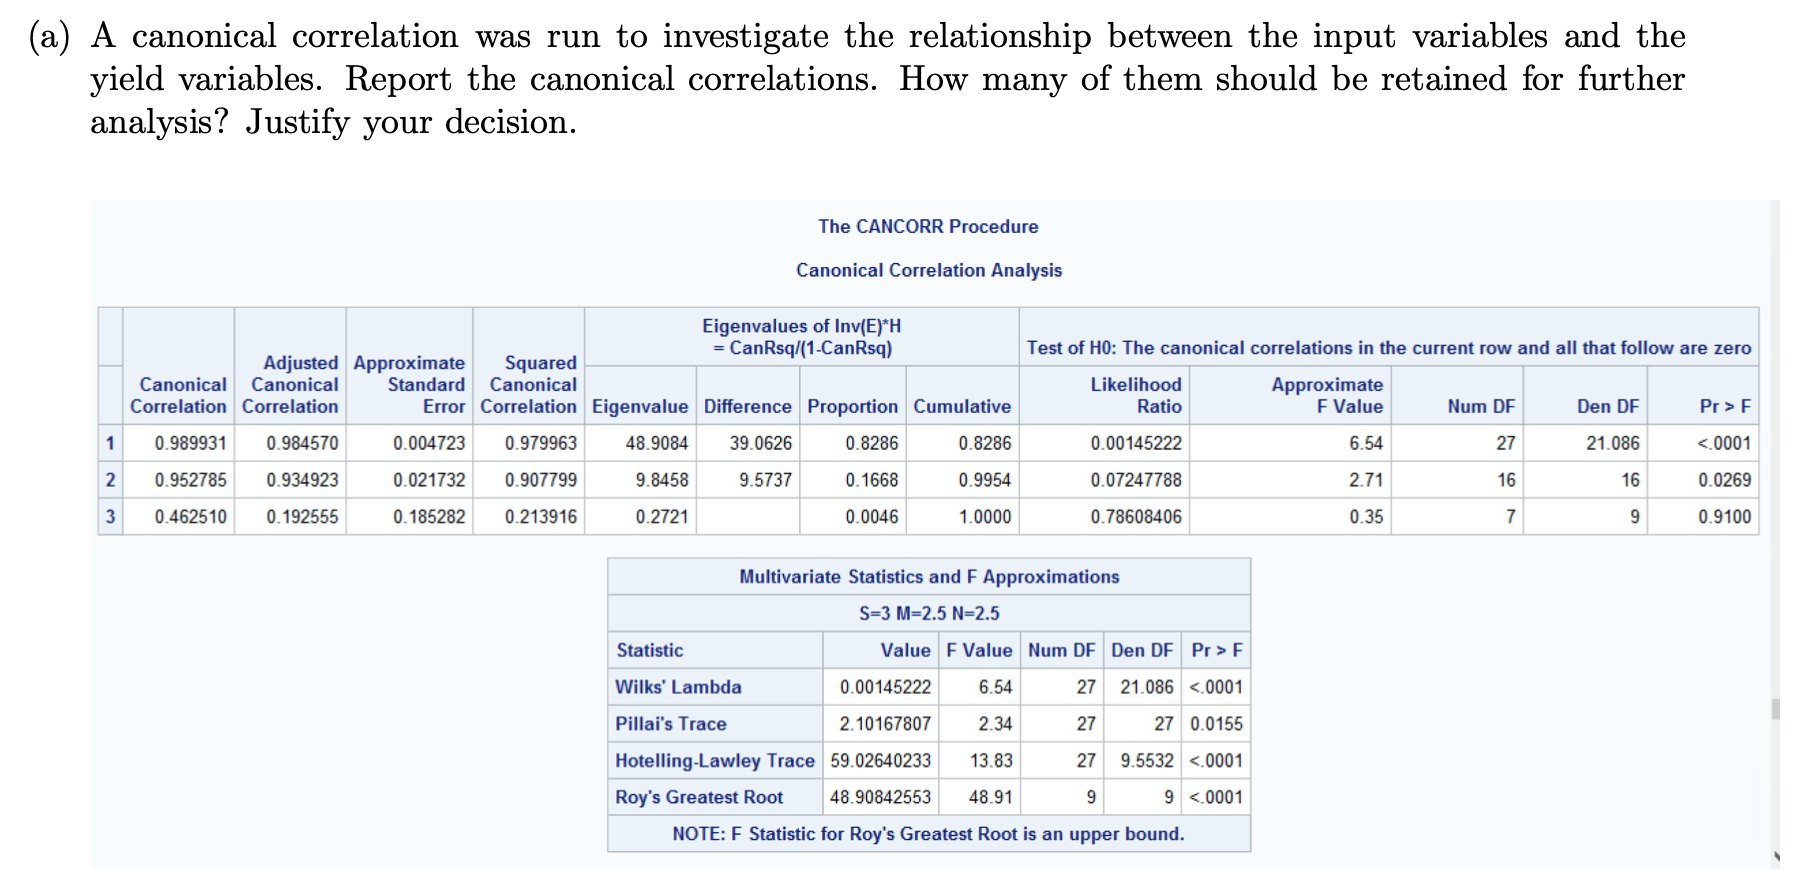
1. The results of a planned experiment involving a chemical reaction were analyzed by Box and Youle in 1955. The input (independent) variables are 331 = temperature $2 - concentration 33 time. The yield (dependent) variables are y1 = percentage of unchanged starting material y2 = percentage converted to the desired product 313 = percentage of unwanted by-product. The researchers were also interested in the quadratic forms of each of the input variables as well as the interaction terms for each of the input variables. (b) Write the equations of the significant canonical variables (based on the method that you think is more appropriate, unstandardized or standardized). Comment on their relative importance of the original variables to the canonical variables. SAS output is below. The CANCORR Procedure The CANCORR Procedure Canonical Correlation Analysis Canonical Correlation Analysis Yield Variables 3 Standardized Canonical Coefficients for the Yield Variables Input Variables 9 Raw Canonical Coefficients for the Yield Variables Yield1 Yield2 Yield3 Observations 19 Yield1 Yield2 Yield3 y1 -1.5360 -4.4704 5.7961 y1 -0. 154140333 -0.448621003 0.5816574597 Means and Standard Deviations y2 -0.2108 -2.8291 2.2280 y2 -0.044697594 -0.599790581 0.4723645093 Variable Mean Standard Deviation y3 -0.4676 -3.1309 5.1442 y3 -0.069490575 -0.465324436 0.7645456585 y1 20.178947 9.964748 Standardized Canonical Coefficients y2 56.336842 4.716780 Raw Canonical Coefficients for the Input Variables for the Input Variables y3 20.784211 6.728403 Input1 Input2 Input3 Input1 Input2 Input3 x1 167.315789 6.218723 x1 0.8060287338 -6.159676072 -2.011212114 x1 5.0125 -38.3053 -12.5072 x2 27.184211 4.236779 x2 1.3819663948 -4. 186902824 -5.718734304 x2 5.8551 -17.7390 -24.2290 x3 6.500000 1.632993 x3 1.0104387954 -4.880523779 -20.04861244 x3 1.6500 -7.9699 -32.7392 x1x2 4536.815789 649.734694 x1x2 -0.006034621 0.0296946773 0.0183798839 x1x2 -3.9209 19.2937 11.9420 x1x3 1087.342105 272.790113 x1x3 -0.008419654 0.0234617494 0.1144430944 x1x3 -2.2968 6.4001 31.2189 x2x3 177.855263 56.105327 x2x3 0.0094750726 0.0144295256 0.0231487669 x2x3 0.5316 0.8096 1.2988 x1sq 28031 2087.121744 x1sq -0.001277125 0.0157122312 0.0023215858 x1sq -2.6655 32.7933 4.8454 x2sq 755.986842 229.288929 x2sq -0.0053844 -0.014671909 0.0470928027 x2sq -1.2346 -3.3641 10.7979 x3sq 44.776316 20.228194 x3sq 0.0281937989 0.0431702123 0.0479841486 x3sq 0.5703 0.8733 0.9706Correlations Among the Original Variables Correlations Among the Yield Variables y1 y2 y3 y1 1.0000 -0.6078 -0.8804 y2 -0.6078 1.0000 0. 1822 y3 -0.8804 0.1822 1.0000 Correlations Among the Input Variables x1 x2 x3 x1x2 x1x3 x2x3 x1sq x2sq x3sq x1 1.0000 -0.4620 -0.0219 -0.2522 0.1279 -0.2670 0.9999 -0.4582 -0.0579 x2 -0.4620 1.0000 0. 1767 0.9739 0.1015 0.6442 -0.4644 0.9967 0.1686 x3 -0.0219 0.1767 1.0000 0.1795 0.9885 0.8623 -0.0210 0. 1861 0.9864 x1x2 -0.2522 0.9739 0. 1795 1.0000 0.1356 0.6285 -0.2553 0.9685 0. 1640 x1x3 0. 1279 0. 1015 0.9885 0.1356 1.0000 0.8135 0.1287 0.1111 0.9711 x2x3 -0.2670 0.6442 0.8623 0.6285 0.8135 1.0000 -0.2674 0.6518 0.8528 x1sq 0.9999 -0.4644 -0.0210 -0.2553 0.1287 -0.2674 1.0000 -0.4601 -0.0581 x2sq -0.4582 0.9967 0. 1861 0.9685 0.1111 0.6518 -0.4601 1.0000 0. 1739 x3sq -0.0579 0.1686 0.9864 0.1640 0.9711 0.8528 -0.0581 0. 1739 1.0000 Correlations Between the Yield Variables and the Input Variables x1 x2 x3 x1x2 x1x3 x2x3 x1sq x2sq x3sq y1 -0.6769 -0.2247 -0.4525 -0.4101 -0.5475 -0.4548 -0.6753 -0.2320 -0.4219 y2 0.4040 0.0800 0.3927 0.1634 0.4399 0.3324 0.4039 0.1193 0.3305 y3 0.5769 0.2256 0.3615 0.3959 0.4478 0.3930 0.5751 0.2196 0.3588(a) A canonical correlation was run to investigate the relationship between the input variables and the yield variables. Report the canonical correlations. How many of them should be retained for further analysis? Justify your decision. The CANCORR Procedure Canonical Correlation Analysis Eigenvalues of Inv(E)*H = CanRsq/(1-CanRsq) Test of HO: The canonical correlations in the current row and all that follow are zero Adjusted Approximate Squared Canonical Canonical Standard Canonical Likelihood Approximate Correlation Correlation Error Correlation Eigenvalue Difference Proportion Cumulative Ratio F Value Num DF Den DF Pr > F 0.989931 0.984570 0.004723 0.979963 48.9084 39.0626 0.8286 0.8286 0.00145222 6.54 27 21.086 <.0001 n multivariate statistics and f approximations s="3" m="2.5" statistic value num df den pr> F Wilks' Lambda 0.00145222 6.54 27 21.086 <.0001 pillai trace hotelling-lawley roy greatest root note: f statistic for is an upper bound>
