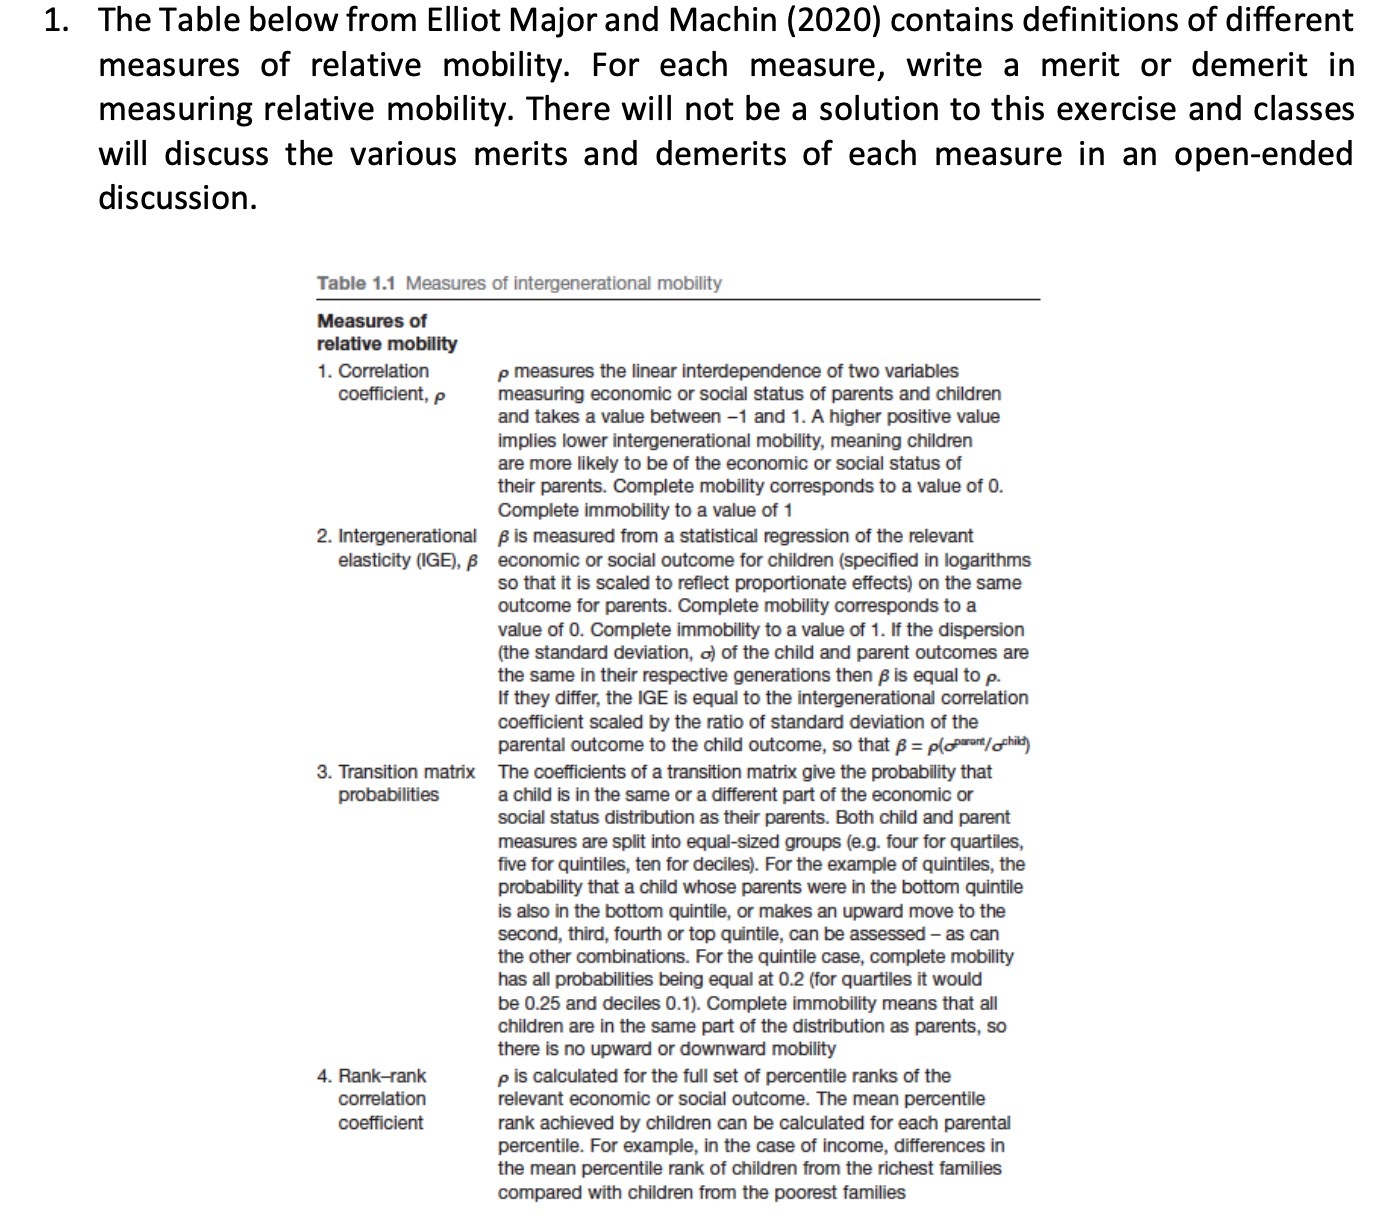
1. The Table below from Elliot Major and Machin (2020) contains definitions of different measures of relative mobility. For each measure, write a merit or demerit in measuring relative mobility. There will not be a solution to this exercise and classes will discuss the various merits and demerits of each measure in an open-ended discussion. Table 1.1 Measures of intergenerational mobility Measures of relative mobility 1. Correlation p measures the linear interdependence of two variables coefficient, p measuring economic or social status of parents and children and takes a value between -1 and 1. A higher positive value implies lower intergenerational mobility, meaning children are more likely to be of the economic or social status of their parents. Complete mobility corresponds to a value of 0. Complete immobility to a value of 1 2. Intergenerational B is measured from a statistical regression of the relevant elasticity (IGE), B economic or social outcome for children (specified in logarithms so that it is scaled to reflect proportionate effects) on the same outcome for parents. Complete mobility corresponds to a value of 0. Complete immobility to a value of 1. If the dispersion (the standard deviation, o) of the child and parent outcomes are the same in their respective generations then B is equal to p. If they differ, the IGE is equal to the intergenerational correlation coefficient scaled by the ratio of standard deviation of the parental outcome to the child outcome, so that B = p(oparam/ @child) 3. Transition matrix The coefficients of a transition matrix give the probability that probabilities a child is in the same or a different part of the economic or social status distribution as their parents. Both child and parent measures are split into equal-sized groups (e.g. four for quartiles, five for quintiles, ten for deciles). For the example of quintiles, the probability that a child whose parents were in the bottom quintile is also in the bottom quintile, or makes an upward move to the second, third, fourth or top quintile, can be assessed - as can the other combinations. For the quintile case, complete mobility has all probabilities being equal at 0.2 (for quartiles it would be 0.25 and deciles 0.1). Complete immobility means that all children are in the same part of the distribution as parents, so there is no upward or downward mobility 4. Rank-rank p is calculated for the full set of percentile ranks of the correlation relevant economic or social outcome. The mean percentile coefficient rank achieved by children can be calculated for each parental percentile. For example, in the case of income, differences in the mean percentile rank of children from the richest families compared with children from the poorest families


