

Answered step by step
Verified Expert Solution
Question
1 Approved Answer
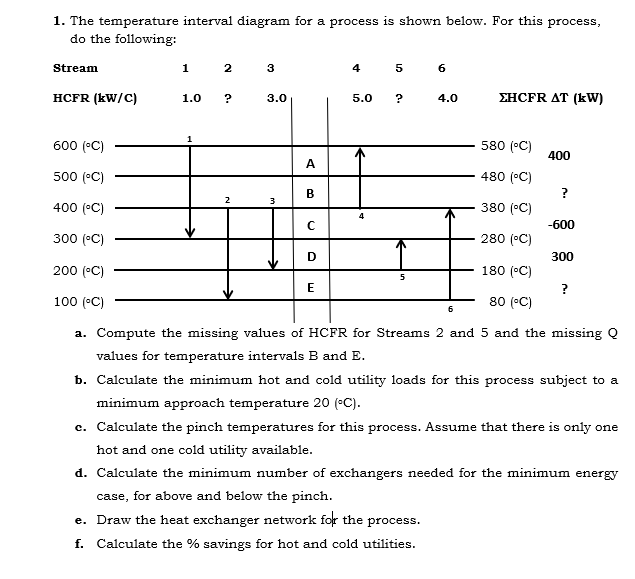
1. The temperature interval diagram for a process is shown below. For this process, do the following: Stream 1 2 3 4 st 5 en
Step by Step Solution
There are 3 Steps involved in it
Step: 1

Get Instant Access to Expert-Tailored Solutions
See step-by-step solutions with expert insights and AI powered tools for academic success
Step: 2

Step: 3
Ace Your Homework with AI
Get the answers you need in no time with our AI-driven, step-by-step assistance
Get Started
Fundamentals Of Thermal-Fluid Sciences
Authors: Yunus Cengel, John Cimbala, Afshin Ghajar
6th Edition
126071697X, 978-1260716979