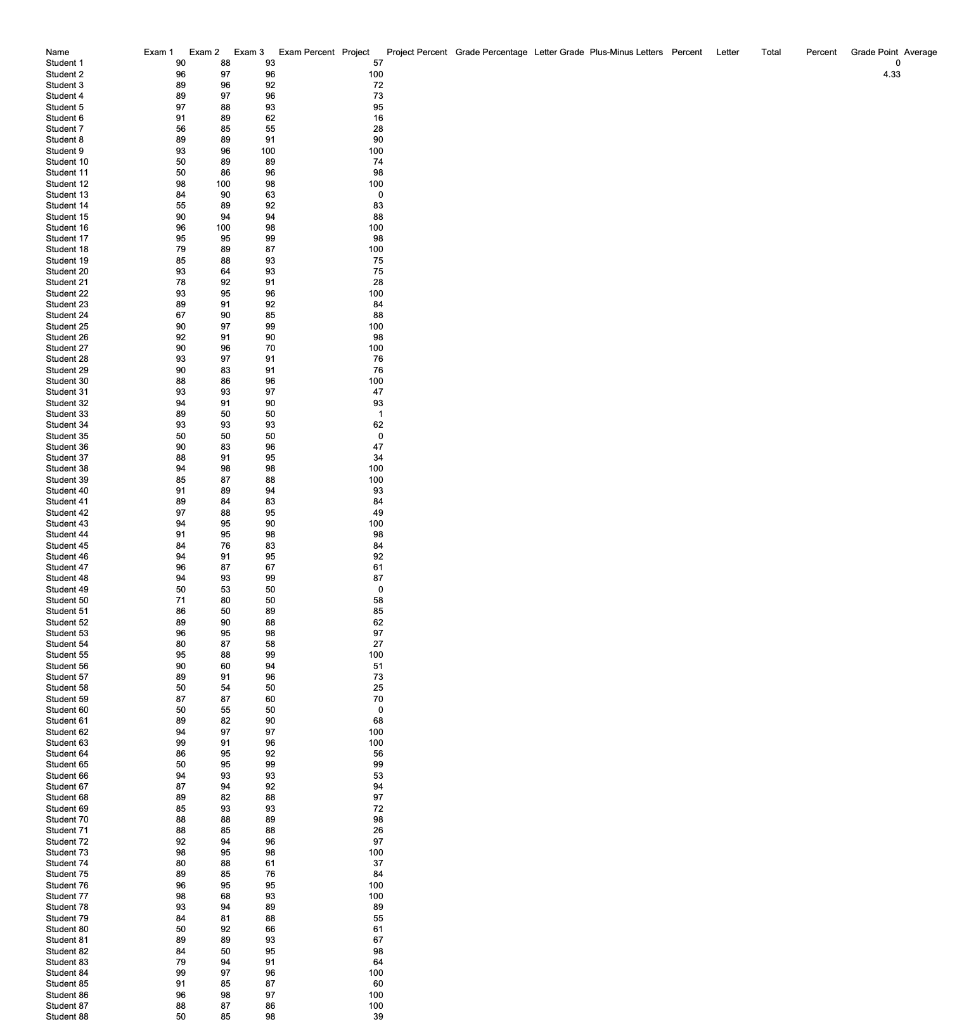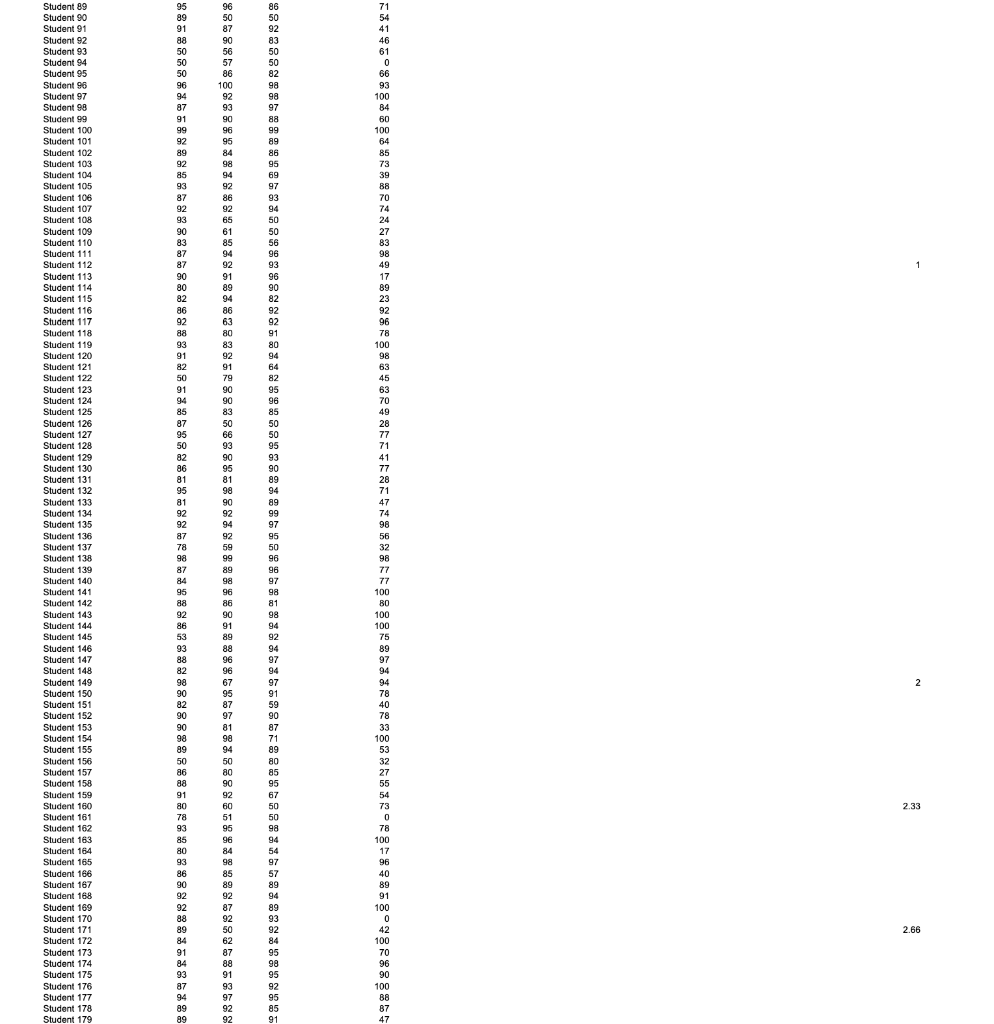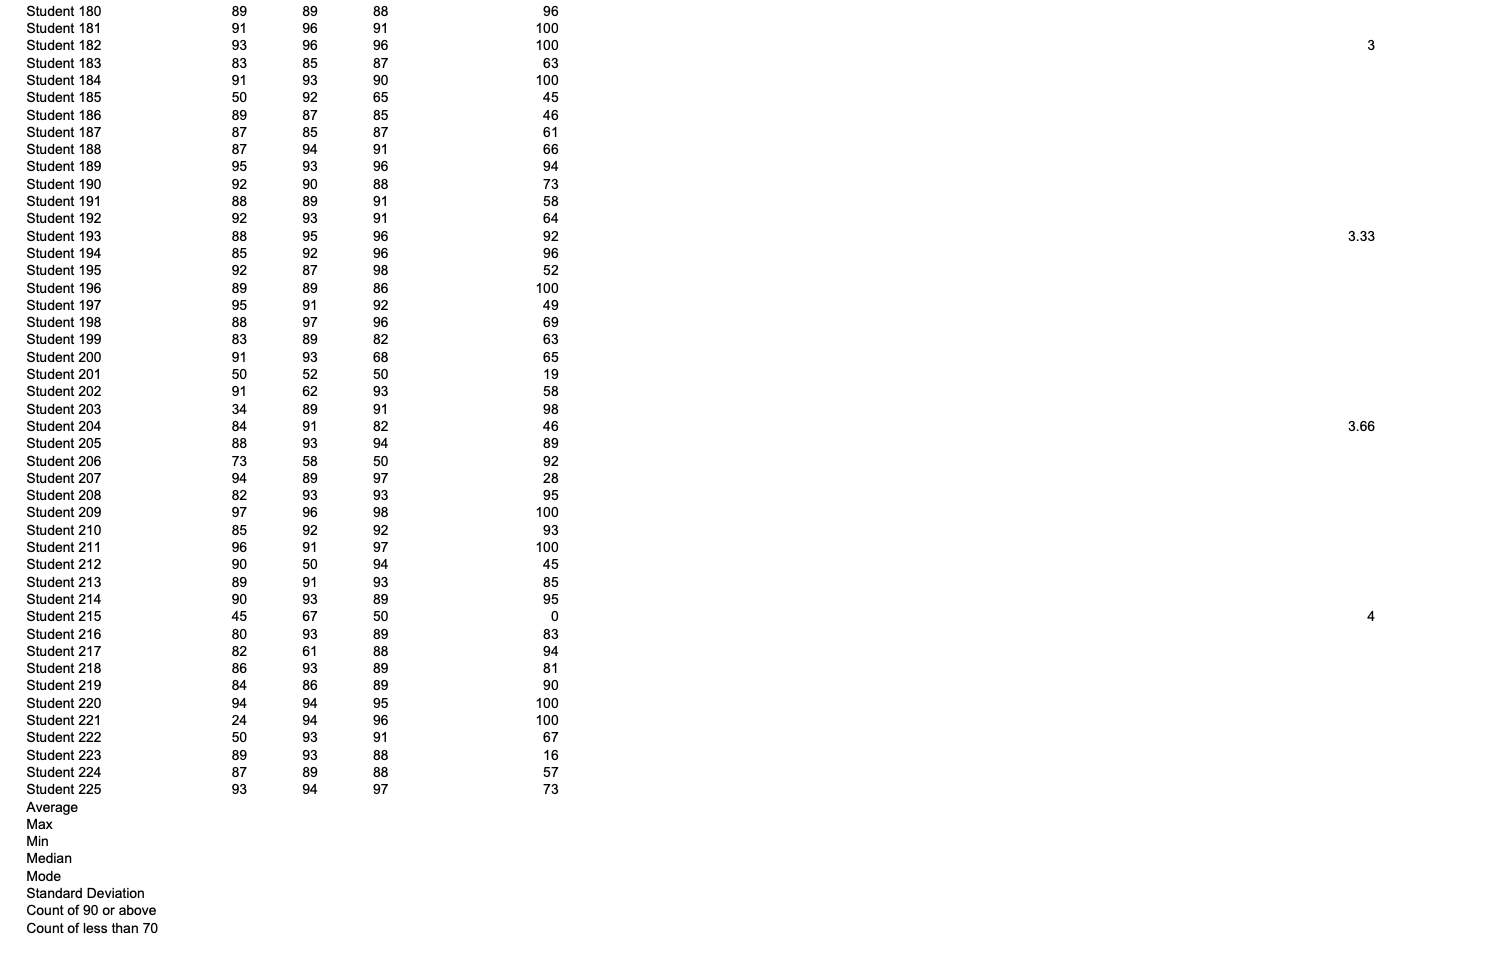


1. This class uses weighting, which you will need to account for in the calculation. Exams are worth 80% of the grade, and the class project is worth 20% of the grade. To calculate the final grade percentage you will need to add up the exam scores; then divide by the total number of exam points and then multiply by the weighted percentage. In a similar manner, calculate the percentage for the project. Then add the two totals together to get the final grade. Remember, students cannot earn more than 100%!! 2. Once you have the grade percentages, then calculate the letter grades and plus/minus letter grades. 3. Next, complete the data for columns M through R showing the grade percentages (Note** do NOT use adjusted percentages!!), the corresponding plus/minus letter that equates to, how many students had that grade, what percentage that is of total students, the grade point and the average. 4. Using the letter grades and total students (columns N and O), create a Grade Distribution graph. 5. Use the technics you learned in the module to complete the file, then complete the assessment questions using the file you create. Letter Total Percent Grade Point Average 0 4.33 100 Name Student 1 Student 2 Student 3 Student 4 Student 5 Student 6 Student 7 Student 8 Student 9 Student 10 Student 11 Student 12 Student 13 Student 14 Student 15 Student 16 Student 17 Student 18 Student 19 Student 20 Student 21 Student 22 Student 23 Student 24 Student 25 Student 26 Student 27 Student 28 Student 29 Student 30 Student 31 Student 32 Student 33 Student 34 Student 35 Student 36 Student 37 Student 38 Student 39 Student 40 Student 41 Student 42 Student 43 Student 44 Student 45 Student 46 Student 47 Student 48 Student 49 Student 50 Student 51 Student 52 Student 53 Student 54 Student 55 Student 56 Student 57 Student 58 Student 59 Student 60 Student 61 Student 62 Student 63 Student 64 Student 65 Student 66 Student 67 Student 68 Student 69 Student 70 Student 71 Student 72 Student 73 Student 74 Student 75 Student 76 Student 77 Student 78 Student 79 Student 80 Student 81 Student 82 Student 83 Student 84 Student 85 Student 86 Student 87 Student 88 Exam 1 Exam 2 Exam 3 Exam Percent Project Project Percent Grade Percentage Letter Grade Plus-Minus Letters Percent 90 88 93 57 96 97 96 100 89 96 92 72 89 97 96 73 97 88 93 95 91 89 62 16 56 85 55 28 89 89 91 90 93 96 100 100 50 89 89 74 50 86 96 98 98 30 98 100 84 90 63 0 55 a9 92 83 90 94 94 88 96 100 98 100 95 95 99 98 79 89 87 100 85 88 93 75 93 64 93 75 78 92 91 28 93 95 96 100 89 91 92 84 67 90 85 88 90 97 99 100 92 91 90 98 90 96 70 100 93 97 91 76 90 83 91 76 88 86 96 100 93 93 97 47 94 91 90 93 89 50 50 1 93 93 93 62 50 50 50 D 90 83 96 47 88 91 95 34 94 98 96 100 85 87 88 100 91 89 94 93 89 84 83 B4 97 88 95 49 94 95 90 100 91 95 98 98 84 76 83 84 94 91 95 92 96 87 67 61 94 93 99 87 50 53 50 0 71 80 50 58 86 50 89 85 89 90 88 62 96 95 98 97 80 87 58 27 95 88 99 100 90 60 94 51 89 91 96 73 50 54 50 25 87 87 60 70 50 55 50 0 0 89 82 90 68 94 97 97 100 99 91 96 100 86 95 92 56 50 95 99 99 94 93 93 53 87 94 92 94 89 82 88 97 85 93 93 72 88 88 89 96 88 85 88 26 92 94 96 97 98 95 96 100 80 88 61 37 89 85 76 84 96 95 95 100 98 68 93 100 93 94 89 89 84 81 88 55 50 92 66 61 89 89 93 67 84 50 95 98 79 94 91 64 99 97 96 100 91 85 87 60 96 98 97 100 88 87 86 100 50 85 96 39 7=%newWwW8%%%%%%%%%%%RTH%TH%%%wmwwBWS%BC%WHwmwww%www W Student 180 Student 181 Student 182 Student 183 Student 184 3 Student 185 3.33 89 91 Student 18 Student 187 Student 188 Student 189 Student 190 Student 191 Student 192 Student 193 Student 194 Student 195 Student 196 Student 197 Student 198 Student 198 Student 199 Student 200 Student 201 Student 202 Student 203 Student 204 Student 205 Student 206 Student 207 Student 208 Student 209 Student 210 Student 211 Student 212 Student 213 Student 214 Student 215 Student 216 Student 217 Student 218 Student 219 Student 220 Student 221 3.66 96 90 89 90 45 90 86 94 Student 222 Student 223 Student 224 Student 225 Average Max Min Median Mode Standard Deviation Count of 90 or above Count of less than 70 1. This class uses weighting, which you will need to account for in the calculation. Exams are worth 80% of the grade, and the class project is worth 20% of the grade. To calculate the final grade percentage you will need to add up the exam scores; then divide by the total number of exam points and then multiply by the weighted percentage. In a similar manner, calculate the percentage for the project. Then add the two totals together to get the final grade. Remember, students cannot earn more than 100%!! 2. Once you have the grade percentages, then calculate the letter grades and plus/minus letter grades. 3. Next, complete the data for columns M through R showing the grade percentages (Note** do NOT use adjusted percentages!!), the corresponding plus/minus letter that equates to, how many students had that grade, what percentage that is of total students, the grade point and the average. 4. Using the letter grades and total students (columns N and O), create a Grade Distribution graph. 5. Use the technics you learned in the module to complete the file, then complete the assessment questions using the file you create. Letter Total Percent Grade Point Average 0 4.33 100 Name Student 1 Student 2 Student 3 Student 4 Student 5 Student 6 Student 7 Student 8 Student 9 Student 10 Student 11 Student 12 Student 13 Student 14 Student 15 Student 16 Student 17 Student 18 Student 19 Student 20 Student 21 Student 22 Student 23 Student 24 Student 25 Student 26 Student 27 Student 28 Student 29 Student 30 Student 31 Student 32 Student 33 Student 34 Student 35 Student 36 Student 37 Student 38 Student 39 Student 40 Student 41 Student 42 Student 43 Student 44 Student 45 Student 46 Student 47 Student 48 Student 49 Student 50 Student 51 Student 52 Student 53 Student 54 Student 55 Student 56 Student 57 Student 58 Student 59 Student 60 Student 61 Student 62 Student 63 Student 64 Student 65 Student 66 Student 67 Student 68 Student 69 Student 70 Student 71 Student 72 Student 73 Student 74 Student 75 Student 76 Student 77 Student 78 Student 79 Student 80 Student 81 Student 82 Student 83 Student 84 Student 85 Student 86 Student 87 Student 88 Exam 1 Exam 2 Exam 3 Exam Percent Project Project Percent Grade Percentage Letter Grade Plus-Minus Letters Percent 90 88 93 57 96 97 96 100 89 96 92 72 89 97 96 73 97 88 93 95 91 89 62 16 56 85 55 28 89 89 91 90 93 96 100 100 50 89 89 74 50 86 96 98 98 30 98 100 84 90 63 0 55 a9 92 83 90 94 94 88 96 100 98 100 95 95 99 98 79 89 87 100 85 88 93 75 93 64 93 75 78 92 91 28 93 95 96 100 89 91 92 84 67 90 85 88 90 97 99 100 92 91 90 98 90 96 70 100 93 97 91 76 90 83 91 76 88 86 96 100 93 93 97 47 94 91 90 93 89 50 50 1 93 93 93 62 50 50 50 D 90 83 96 47 88 91 95 34 94 98 96 100 85 87 88 100 91 89 94 93 89 84 83 B4 97 88 95 49 94 95 90 100 91 95 98 98 84 76 83 84 94 91 95 92 96 87 67 61 94 93 99 87 50 53 50 0 71 80 50 58 86 50 89 85 89 90 88 62 96 95 98 97 80 87 58 27 95 88 99 100 90 60 94 51 89 91 96 73 50 54 50 25 87 87 60 70 50 55 50 0 0 89 82 90 68 94 97 97 100 99 91 96 100 86 95 92 56 50 95 99 99 94 93 93 53 87 94 92 94 89 82 88 97 85 93 93 72 88 88 89 96 88 85 88 26 92 94 96 97 98 95 96 100 80 88 61 37 89 85 76 84 96 95 95 100 98 68 93 100 93 94 89 89 84 81 88 55 50 92 66 61 89 89 93 67 84 50 95 98 79 94 91 64 99 97 96 100 91 85 87 60 96 98 97 100 88 87 86 100 50 85 96 39 7=%newWwW8%%%%%%%%%%%RTH%TH%%%wmwwBWS%BC%WHwmwww%www W Student 180 Student 181 Student 182 Student 183 Student 184 3 Student 185 3.33 89 91 Student 18 Student 187 Student 188 Student 189 Student 190 Student 191 Student 192 Student 193 Student 194 Student 195 Student 196 Student 197 Student 198 Student 198 Student 199 Student 200 Student 201 Student 202 Student 203 Student 204 Student 205 Student 206 Student 207 Student 208 Student 209 Student 210 Student 211 Student 212 Student 213 Student 214 Student 215 Student 216 Student 217 Student 218 Student 219 Student 220 Student 221 3.66 96 90 89 90 45 90 86 94 Student 222 Student 223 Student 224 Student 225 Average Max Min Median Mode Standard Deviation Count of 90 or above Count of less than 70


