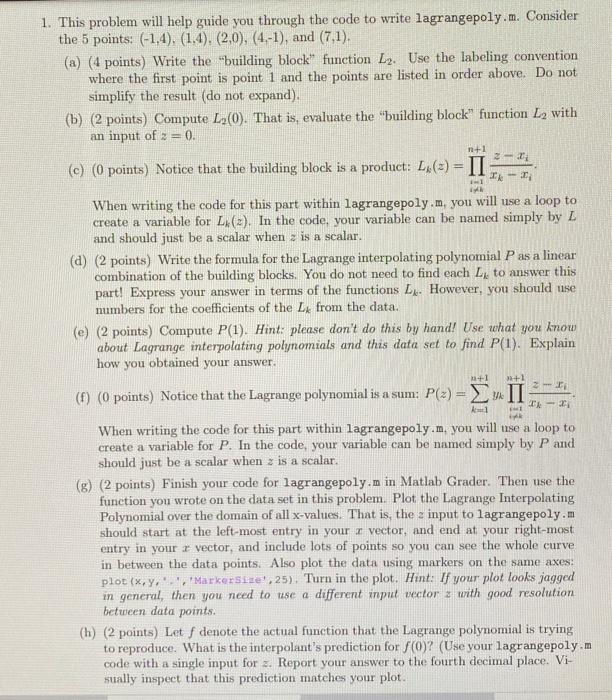
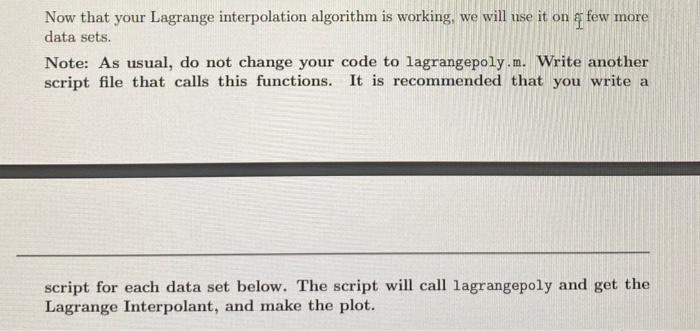
1. This problem will help guide you through the code to write lagrangepoly.m. Consider the 5 points: (-1,4), (1.4). (2,0), (4-1), and (7.1). (a) (4 points) Write the "building block" function L2. Use the labeling convention where the first point is point 1 and the points are listed in order above. Do not simplify the result (do not expand), (b) (2 points) Compute L2(0). That is, evaluate the "building block" function L2 with an input of = 0. n+1 20 (c) (0 points) Notice that the building block is a product: L. (2) = II 20 When writing the code for this part within lagrangepoly.m, you will use a loop to create a variable for L. (2). In the code, your variable can be named simply by L and should just be a scalar when z is a scalar. (a) (2 points) Write the formula for the Lagrange interpolating polynomial P as a linear combination of the building blocks. You do not need to find each L to answer this part! Express your answer in terms of the functions L. However, you should use members for the coefficients of the Le from the data. (e) (2 points) Compute P(1). Hint: please don't do this by hand! Use what you know about Lagrange interpolating polynomials and this data set to find P(1). Explain how you obtained your answer. +1 +1 2 (f) (0 points) Notice that the Lagrange polynomial is a sum: P(z) = II 1 TX-30 When writing the code for this part within lagrangepoly.m. you will use a loop to create a variable for P. In the code, your variable can be named simply by P and should just be a scalar when z is a scalar. (g) (2 points) Finish your code for lagrangepoly.m in Matlab Grader. Then use the function you wrote on the data set in this problem. Plot the Lagrange Interpolating Polynomial over the domain of all x-values. That is, the input to lagrangepoly.. should start at the left-most entry in your 1 vector, and end at your right-most entry in your vector, and include lots of points so you can see the whole curve in between the data points. Also plot the data using markers on the same axes: plot(x,y,'',Markersize',25). Turn in the plot. Hint: If your plot looks jagged in general, then you need to use a different input vector with good resolution between data points. (h) (2 points) Let f denote the actual function that the Lagrange polynomial is trying to reproduce. What is the interpolant's prediction for (0)? (Use your lagrangepoly.m code with a single input for . Report your answer to the fourth decimal place. Vi- sually inspect that this prediction matches your plot. Now that your Lagrange interpolation algorithm is working, we will use it on q few more data sets. Note: As usual, do not change your code to lagrangepoly.m. Write another script file that calls this functions. It is recommended that you write a script for each data set below. The script will call lagrangepoly and get the Lagrange Interpolant, and make the plot. 1. This problem will help guide you through the code to write lagrangepoly.m. Consider the 5 points: (-1,4), (1.4). (2,0), (4-1), and (7.1). (a) (4 points) Write the "building block" function L2. Use the labeling convention where the first point is point 1 and the points are listed in order above. Do not simplify the result (do not expand), (b) (2 points) Compute L2(0). That is, evaluate the "building block" function L2 with an input of = 0. n+1 20 (c) (0 points) Notice that the building block is a product: L. (2) = II 20 When writing the code for this part within lagrangepoly.m, you will use a loop to create a variable for L. (2). In the code, your variable can be named simply by L and should just be a scalar when z is a scalar. (a) (2 points) Write the formula for the Lagrange interpolating polynomial P as a linear combination of the building blocks. You do not need to find each L to answer this part! Express your answer in terms of the functions L. However, you should use members for the coefficients of the Le from the data. (e) (2 points) Compute P(1). Hint: please don't do this by hand! Use what you know about Lagrange interpolating polynomials and this data set to find P(1). Explain how you obtained your answer. +1 +1 2 (f) (0 points) Notice that the Lagrange polynomial is a sum: P(z) = II 1 TX-30 When writing the code for this part within lagrangepoly.m. you will use a loop to create a variable for P. In the code, your variable can be named simply by P and should just be a scalar when z is a scalar. (g) (2 points) Finish your code for lagrangepoly.m in Matlab Grader. Then use the function you wrote on the data set in this problem. Plot the Lagrange Interpolating Polynomial over the domain of all x-values. That is, the input to lagrangepoly.. should start at the left-most entry in your 1 vector, and end at your right-most entry in your vector, and include lots of points so you can see the whole curve in between the data points. Also plot the data using markers on the same axes: plot(x,y,'',Markersize',25). Turn in the plot. Hint: If your plot looks jagged in general, then you need to use a different input vector with good resolution between data points. (h) (2 points) Let f denote the actual function that the Lagrange polynomial is trying to reproduce. What is the interpolant's prediction for (0)? (Use your lagrangepoly.m code with a single input for . Report your answer to the fourth decimal place. Vi- sually inspect that this prediction matches your plot. Now that your Lagrange interpolation algorithm is working, we will use it on q few more data sets. Note: As usual, do not change your code to lagrangepoly.m. Write another script file that calls this functions. It is recommended that you write a script for each data set below. The script will call lagrangepoly and get the Lagrange Interpolant, and make the plot


