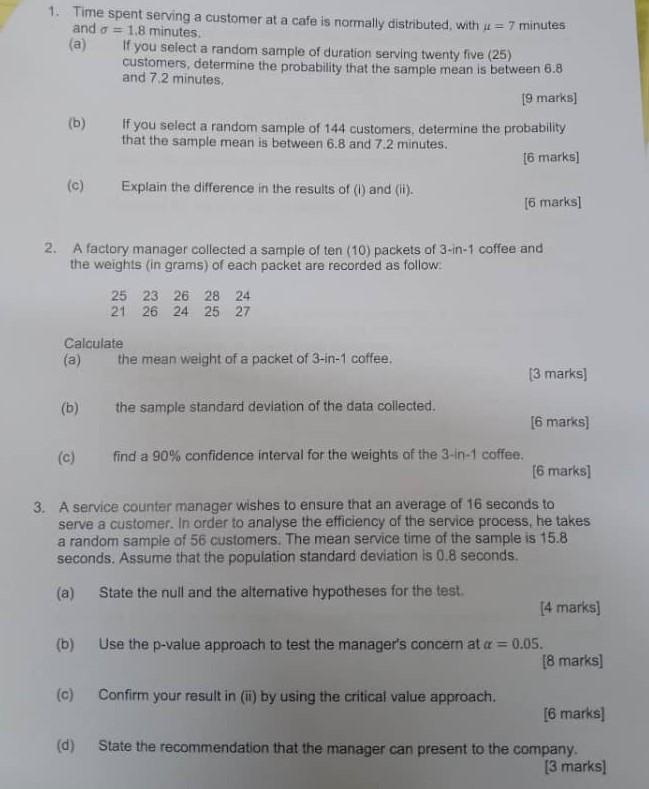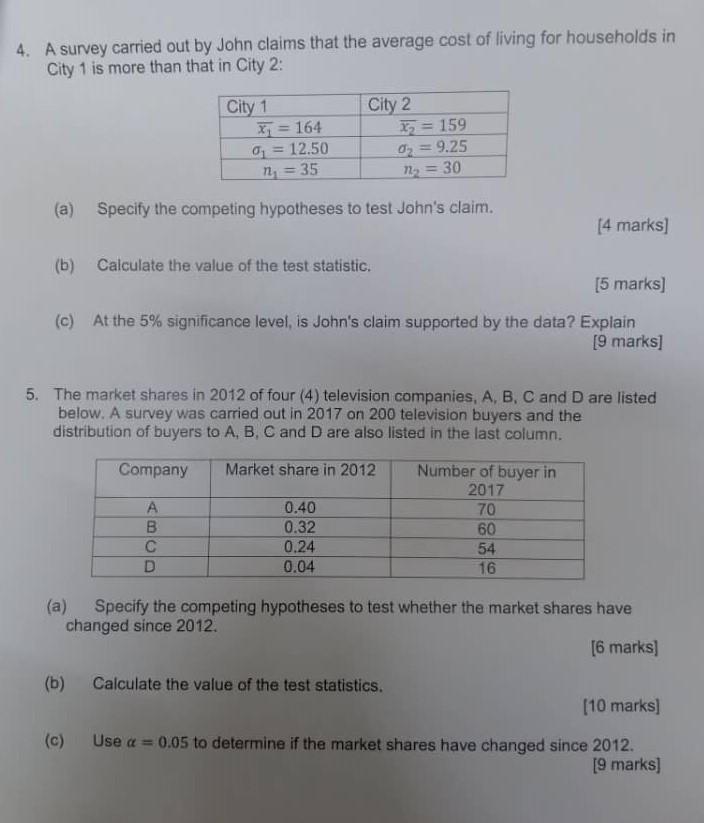

1. Time spent serving a customer at a cafe is normally distributed, with u = 7 minutes and o = 1.8 minutes (a) If you select a random sample of duration serving twenty five (25) customers, determine the probability that the sample mean is between 6.8 and 72 minutes 19 marks] (b) If you select a random sample of 144 customers, determine the probability that the sample mean is between 6.8 and 7.2 minutes. [6 marks] Explain the difference in the results of (l) and (1) [6 marks] 2. A factory manager collected a sample of ten (10) packets of 3-in-1 coffee and the weights (in grams) of each packet are recorded as follow 25 23 26 28 24 21 26 24 25 27 Calculate (a) the mean weight of a packet of 3-in-1 coffee. [3 marks] (b) the sample standard deviation of the data collected. [6 marks) find a 90% confidence interval for the weights of the 3-in-1 coffee [6 marks] 3. A service counter manager wishes to ensure that an average of 16 seconds to serve a customer. In order to analyse the efficiency of the service process, he takes a random sample of 56 customers. The mean service time of the sample is 15.8 seconds. Assume that the population standard deviation is 0.8 seconds. (a) State the null and the alternative hypotheses for the test. [4 marks) (b) Use the p-value approach to test the manager's concern at = 0.05. [8 marks] (c) Confirm your result in (r) by using the critical value approach. [6 marks State the recommendation that the manager can present to the company. [3 marks] 4. A survey carried out by John claims that the average cost of living for households in City 1 is more than that in City 2: City 1 = 164 a = 12.50 n = 35 City 2 15 = 159 02 = 9.25 n2 = 30 (a) Specify the competing hypotheses to test John's claim. [4 marks] (b) Calculate the value of the test statistic, (5 marks) (c) At the 5% significance level, is John's claim supported by the data? Explain [9 marks] 5. The market shares in 2012 of four (4) television companies, A, B, C and D are listed below. A survey was carried out in 2017 on 200 television buyers and the distribution of buyers to A, B, C and D are also listed in the last column. Company Market share in 2012 B D 0.40 0.32 0.24 0.04 Number of buyer in 2017 70 60 54 16 (a) Specify the competing hypotheses to test whether the market shares have changed since 2012. [6 marks] (b) Calculate the value of the test statistics. [10 marks) (c) Use a = 0.05 to determine if the market shares have changed since 2012. [9 marks)


