

Answered step by step
Verified Expert Solution
Question
1 Approved Answer
1. To answer this problem, please use the Supply & Demand for Points_C|ass Data Excel le posted on Canvas. a. g. h. Provide a scatter
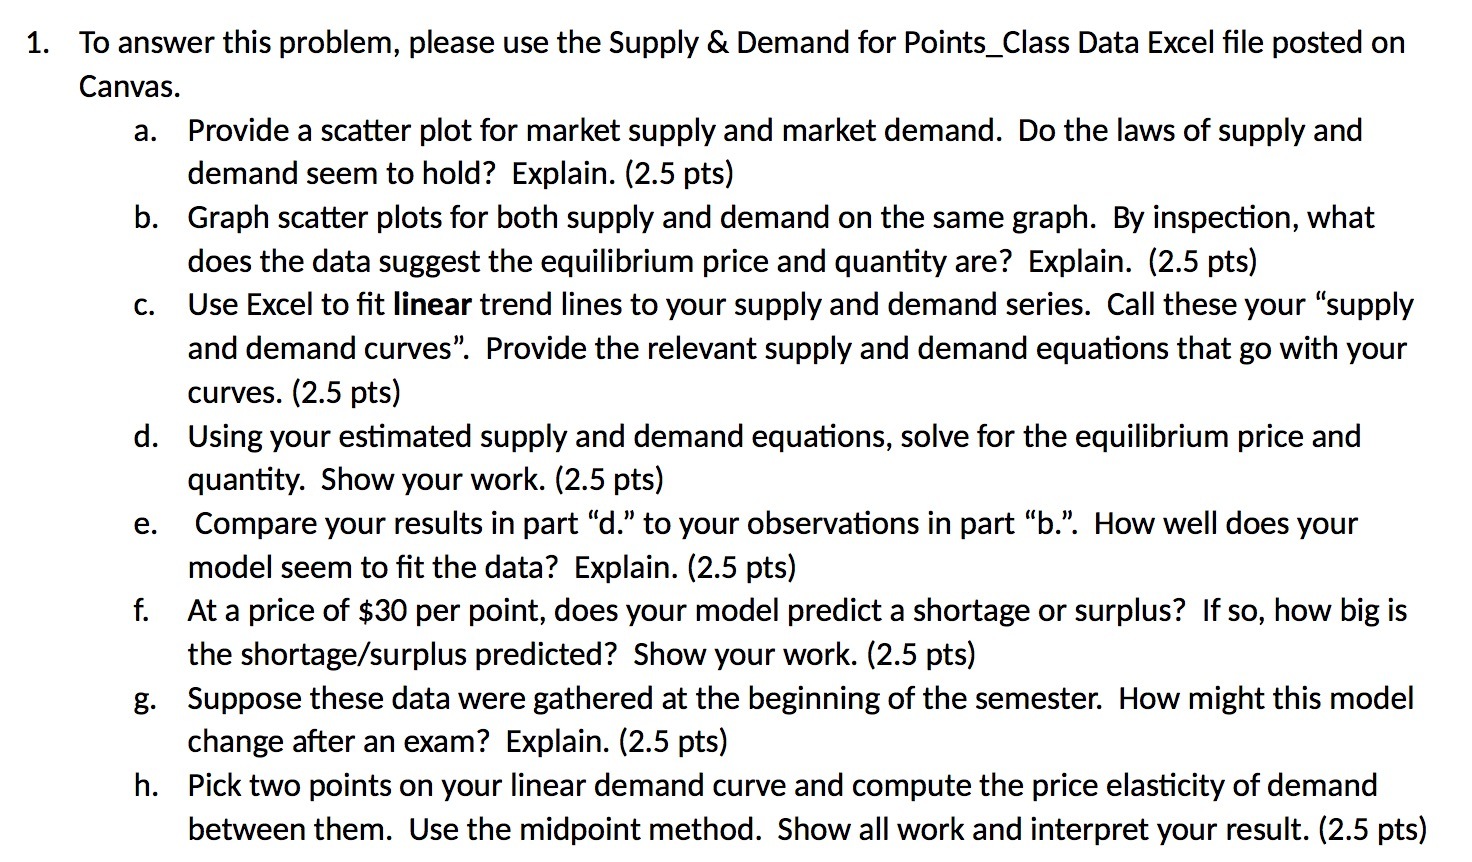 1. To answer this problem, please use the Supply & Demand for Points_C|ass Data Excel le posted on Canvas. a. g. h. Provide a scatter plot for market supply and market demand. Do the laws of supply and demand seem to hold? Explain. (2.5 pts) Graph scatter plots for both supply and demand on the same graph. By inspection, what does the data suggest the equilibrium price and quanty are? Explain. (2.5 pts) Use Excel to t linear trend lines to your supply and demand series. Call these your \"supply and demand curves\". Provide the relevant supply and demand equations that go with your curves. (2.5 pts) Using your estimated supply and demand equations, solve for the equilibrium price and quantity. Show your work. (2.5 pts) Compare your results in part \"d." to your observations in part \"b.". How well does your model seem to t the data? Explain. (2.5 pts) At a price of $30 per point, does your model predict a shortage or surplus? If so, how big is the shortage/surplus predicted? Show your work. (2.5 pts) Suppose these data were gathered at the beginning of the semester. How might this model change after an exam? Explain. (2.5 pts) Pick two points on your linear demand curve and compute the price elasticity of demand between them. Use the midpoint method. Show all work and interpret your result. (2.5 pts)
Step by Step Solution
There are 3 Steps involved in it
Step: 1

Get Instant Access to Expert-Tailored Solutions
See step-by-step solutions with expert insights and AI powered tools for academic success
Step: 2

Step: 3
Ace Your Homework with AI
Get the answers you need in no time with our AI-driven, step-by-step assistance
Get Started
Principles of economics
Authors: N. Gregory Mankiw
6th Edition
978-0538453059, 9781435462120, 538453052, 1435462122, 978-0538453042