Answered step by step
Verified Expert Solution
Question
1 Approved Answer
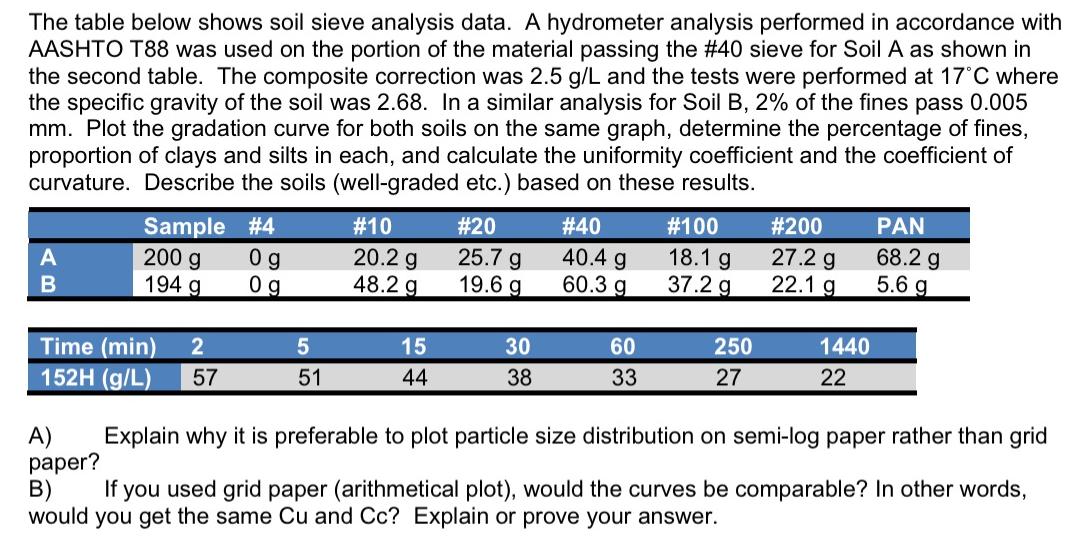
The table below shows soil sieve analysis data. A hydrometer analysis performed in accordance with AASHTO T88 was used on the portion of the

The table below shows soil sieve analysis data. A hydrometer analysis performed in accordance with AASHTO T88 was used on the portion of the material passing the #40 sieve for Soil A as shown in the second table. The composite correction was 2.5 g/L and the tests were performed at 17C where the specific gravity of the soil was 2.68. In a similar analysis for Soil B, 2% of the fines pass 0.005 mm. Plot the gradation curve for both soils on the same graph, determine the percentage of fines, proportion of clays and silts in each, and calculate the uniformity coefficient and the coefficient of curvature. Describe the soils (well-graded etc.) based on these results. A B Sample #4 200 g 194 g Time (min) 2 152H (g/L) 57 09 Og 5 51 # 10 20.2 g 48.2 g 15 44 # 20 25.7 g 19.6 g 30 38 #40 40.4 g 60.3 g 60 33 #100 18.1 g 37.2 g 250 27 #200 27.2 g 22.1 g 1440 22 PAN 68.2 g 5.6 g A) Explain why it is preferable to plot particle size distribution on semi-log paper rather than grid paper? B) If you used grid paper (arithmetical plot), would the curves be comparable? In other words, would you get the same Cu and Cc? Explain or prove your answer.
Step by Step Solution
There are 3 Steps involved in it
Step: 1
Here are the steps to solve this problem 1 Plot the gradation curves for Soils A and B on semilog gr...
Get Instant Access to Expert-Tailored Solutions
See step-by-step solutions with expert insights and AI powered tools for academic success
Step: 2

Step: 3

Ace Your Homework with AI
Get the answers you need in no time with our AI-driven, step-by-step assistance
Get Started


