

Answered step by step
Verified Expert Solution
Question
1 Approved Answer
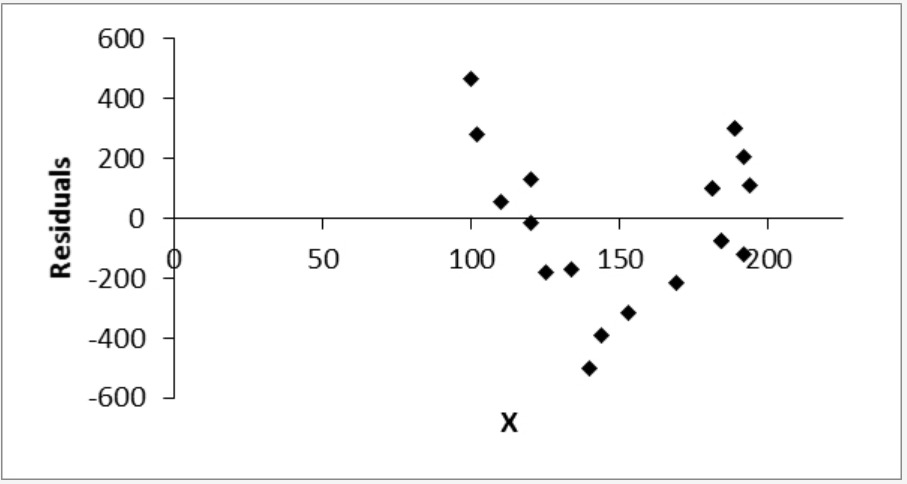
1.) Twenty pairs of measurements were taken at random to estimate the relation between variables X and Y. A least-squares line was fitted to the
1.) Twenty pairs of measurements were taken at random to estimate the relation between variables X and Y. A least-squares line was fitted to the collected data. The resulting residual plot is shown.
Step by Step Solution
There are 3 Steps involved in it
Step: 1

Get Instant Access to Expert-Tailored Solutions
See step-by-step solutions with expert insights and AI powered tools for academic success
Step: 2

Step: 3
Ace Your Homework with AI
Get the answers you need in no time with our AI-driven, step-by-step assistance
Get Started