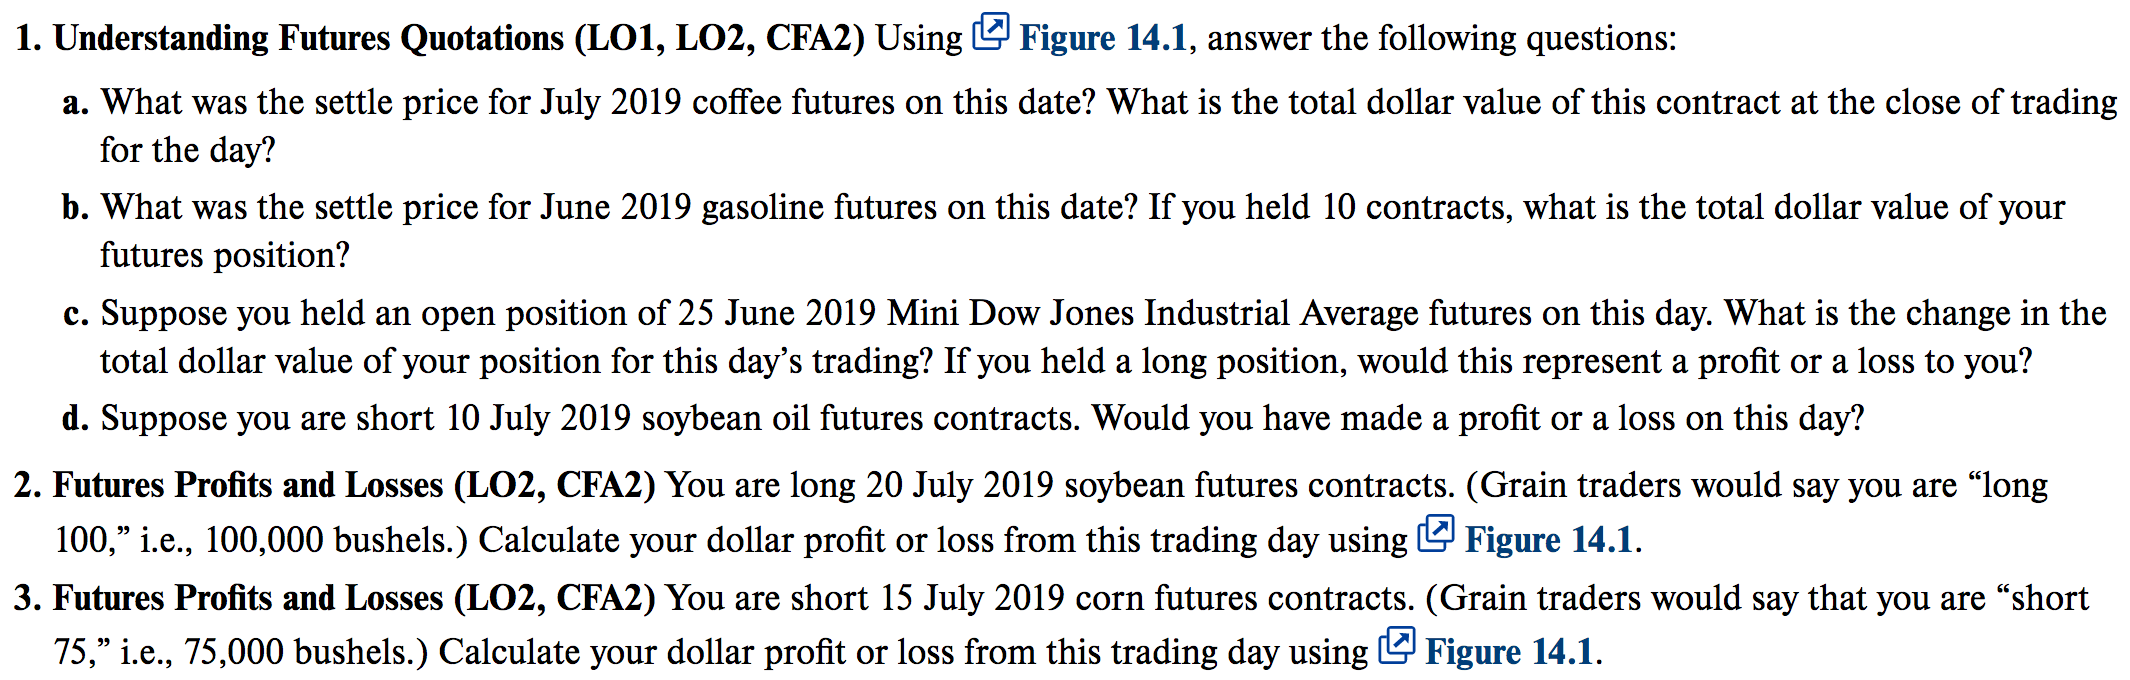
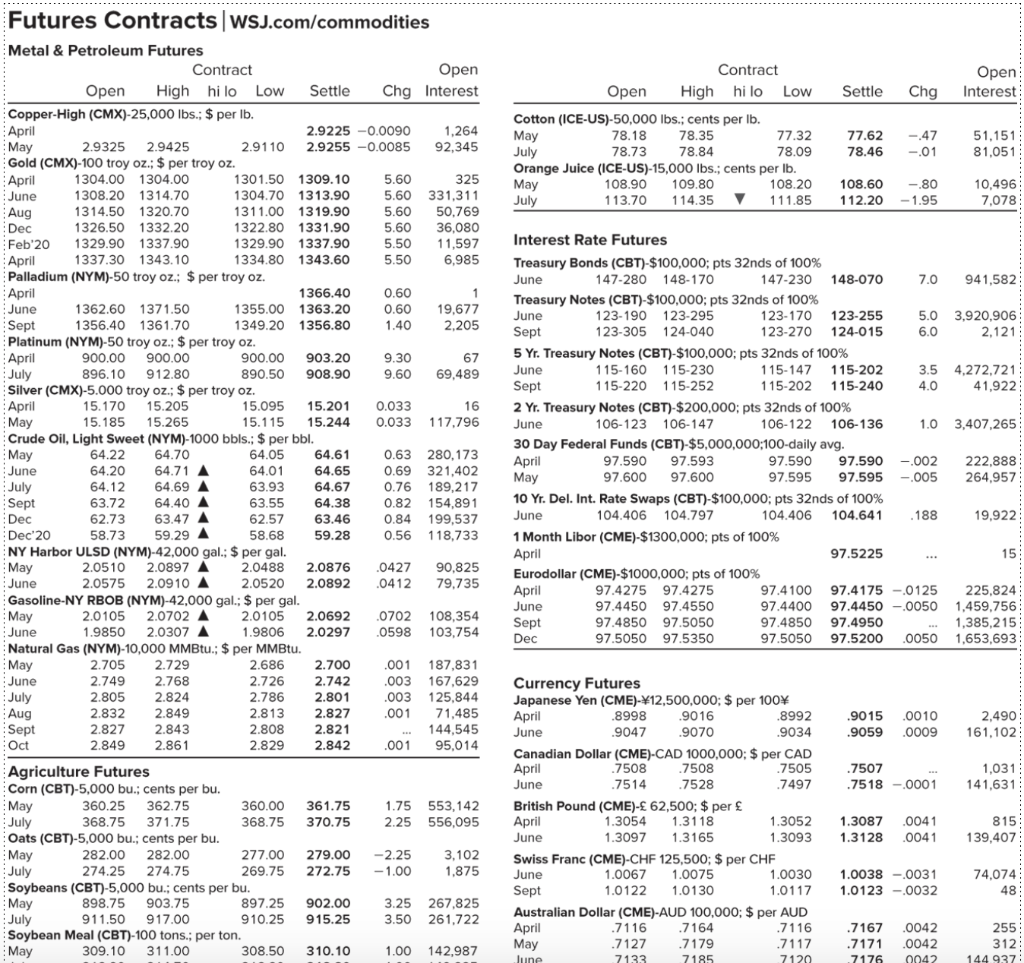
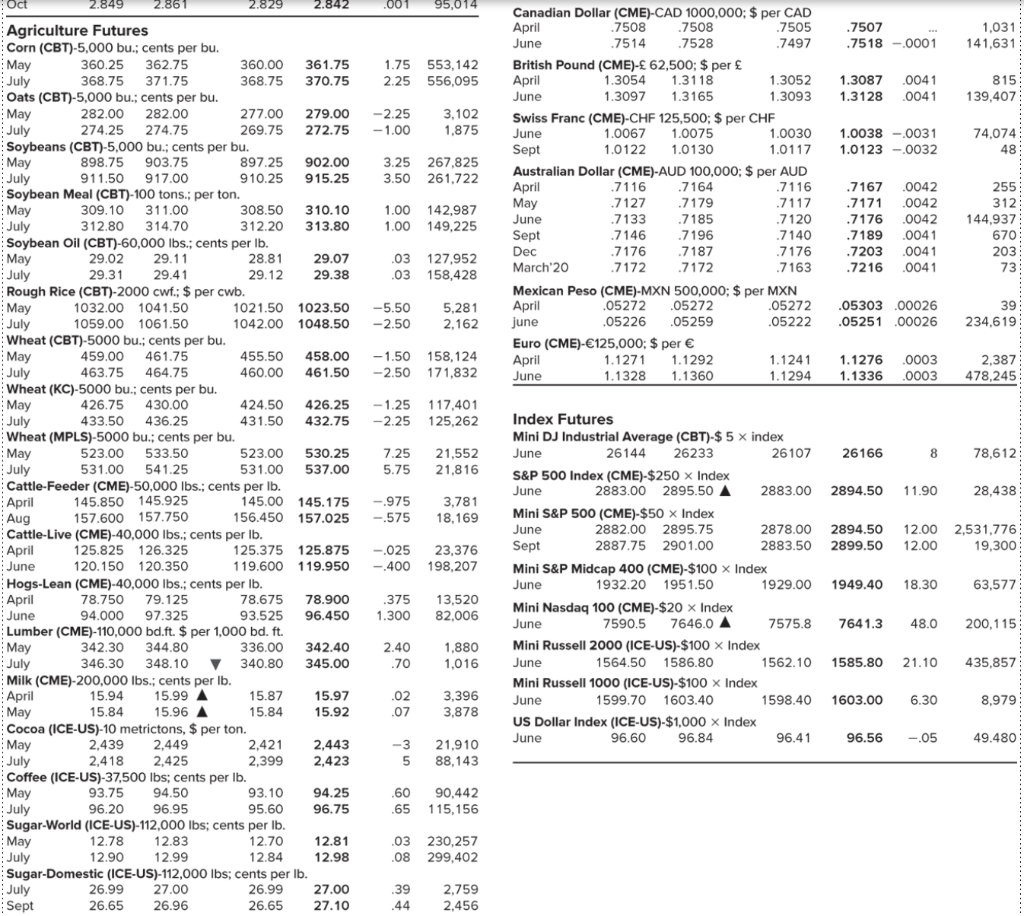
1. Understanding Futures Quotations (L01, LO2, CFA2) Using Figure 14.1, answer the following questions: a. What was the settle price for July 2019 coffee futures on this date? What is the total dollar value of this contract at the close of trading for the day? b. What was the settle price for June 2019 gasoline futures on this date? If you held 10 contracts, what is the total dollar value of your futures position? c. Suppose you held an open position of 25 June 2019 Mini Dow Jones Industrial Average futures on this day. What is the change in the total dollar value of your position for this day's trading? If you held a long position, would this represent a profit or a loss to you? d. Suppose you are short 10 July 2019 soybean oil futures contracts. Would you have made a profit or a loss on this day? 2. Futures Profits and Losses (LO2, CFA2) You are long 20 July 2019 soybean futures contracts. (Grain traders would say you are long 100, i.e., 100,000 bushels.) Calculate your dollar profit or loss from this trading day using Figure 14.1. 3. Futures Profits and Losses (LO2, CFA2) You are short 15 July 2019 corn futures contracts. (Grain traders would say that you are short 75," i.e., 75,000 bushels.) Calculate your dollar profit or loss from this trading day using Figure 14.1. Open Interest Settle Chg Contract Open High hi lo Low Cotton (ICE-US)-50,000 lbs., cents per lb. May 78.18 78.35 77.32 July 78.73 78.84 78.09 Orange Juice (ICE-US)-15,000 lbs.; cents per lb. May 108.90 109.80 108.20 July 113.70 114.35 111.85 77.62 78.46 -.47 -.01 51,151 81.051 108.60 112.20 -.80 -1.95 10,496 7,078 Feb 20 Futures Contracts WSJ.com/commodities Metal & Petroleum Futures Contract Open Open High hilo Low Settle Chg Interest Copper-High (CMX)-25,000 lbs.; $ per lb. April 2.9225 -0.0090 1,264 May 2.9325 2.9425 2.9110 2.9255 -0.0085 92,345 Gold (CMX)-100 troy oz.: $ per troy oz. April 1304.00 1304.00 1301.50 1309.10 5.60 325 June June 1308.20 1314.70 1304.70 1313.90 5.60 331,311 Aug 1314.50 1320.70 1311.00 1319.90 5.60 50,769 Dec 1326.50 1332.20 1322.80 1331.90 5.60 36,080 1329.90 1337.90 1329.90 1337.90 5.50 11,597 April 1337.30 1343.10 1334.80 1343.60 5.50 6,985 Palladium (NYM)-50 troy oz.; $ per troy oz. April 1366.40 0.60 1 June 1362.60 1371.50 1355.00 1363.20 0.60 19,677 Sept 1356.40 1361.70 1349.20 1356.80 1.40 2.205 Platinum (NYM)-50 troy oz.: $ per troy oz. April 900.00 900.00 900.00 903.20 9.30 67 July 896.10 912.80 890.50 908.90 9.60 69,489 Silver (CMX)-5.000 troy oz: $ per troy oz. April 15.170 15.205 15.095 15.201 0.033 16 May 15.185 15.265 15.115 15.244 0.033 117.796 Crude Oil, Light Sweet (NYM)-1000 bbls.; $ per bbl. 64.22 64.70 64.05 64.61 0.63 280,173 June 64.20 64.71 A 64.01 64.65 0.69 321,402 July 64.12 64.69 A 64.67 0.76 189,217 Sept 63.72 64.40 A CE 63.55 64.38 14 0.82 154,891 Dec 62.73 63.47 CE 62.57 63.46 0.84 199,537 58.73 59.29 58.68 30.00 59.28 0.56 118,733 NY Harbor ULSD (NYM)-42,000 gal: $ per gal. May 2.0510 2.0897 A 2.0488 2.0876 .0427 90,825 June 2.0910 A 2.0892 .0412 79.735 Gasoline-NY RBOB (NYM)-42,000 gal.; $ per gal. May 2.0105 2.0702 A 2.0105 2.0692 .0702 108,354 June 1.9850 2.0307 1.9806 2.0297 .0598 103.754 Natural Gas (NYM)-10,000 MMBtu.; $ per MMBtu. May 2.705 2.729 way 2.686 2.700 .001 187,831 June 2.749 2.768 2.726 2.742 .003 167,629 July 2.805 2.824 2.786 2.801 .003 125.844 Aug 2.832 2.849 2.813 2.827 .001 71,485 Sept 2.827 2.843 2.808 2.821 144,545 Oct 2.849 2.861 2.829 2.842 .001 95,014 Agriculture Futures Corn (CBT)-5,000 bu.: cents per bu. May 360.25 362.75 360.00 361.75 1.75 553,142 July 368.75 371.75 368.75 370.75 2.25 556,095 Oats (CBT)-5,000 bu.; cents per bu. May 282.00 282.00 277.00 279.00 -2.25 3.102 July 274.25 274.75 269.75 272.75 -1.00 1,875 Soybeans (CBT)-5,000 bu.; cents per bu. 898.75 903.75 897.25 902.00 3.25 267,825 July 911.50 910.25 915.25 3.50 261,722 Soybean Meal (CBT)-100 tons.; per ton. 309.10 311.00 308.50 310.10 1.00 142,987 Interest Rate Futures Treasury Bonds (CBT)-$100,000; pts 32nds of 100% June 147-280 148-170 147-230 148-070 7.0 941,582 Treasury Notes (CBT)-$100,000; pts 32nds of 100% June 123-190 123-295 123-170 123-255 5.0 3.920,906 Sept 123-305 124-040 123-270 124-015 6.0 2,121 5 Yr. Treasury Notes (CBT)-$100,000; pts 32nds of 100% June 115-160 115-230 115-147 115-202 3.5 4,272,721 Sept 115-220 115-252 115-202 115-240 4.0 41,922 2 Yr. Treasury Notes (CBT) $200,000; pts 32nds of 100% June 106-123 106-147 106-122 106-136 1.0 3,407,265 30 Day Federal Funds (CBT)-$5,000,000:100-daily avg. April 97.590 97.593 97.590 97.590 -.002 222.888 May 97.600 97.600 97.595 97.595 -.005 264,957 10 Yr. Del. Int. Rate Swaps (CBT)-$100,000; pts 32nds of 100% June 104.406 104.797 104.406 104.641 .188 19,922 1 Month Libor (CME) $1300,000; pts of 100% April 97.5225 15 Eurodollar (CME)-$1000,000; pts of 100% April 97.4275 97.4275 97.4100 97.4175 -0125 225,824 June 97.4450 97.4550 97.4400 97.4450 -.0050 1,459,756 Sept 97.4850 97.5050 97.4850 97.4950 1,385,215 Dec 97.5050 97.5350 97.5050 97.5200 .0050 1,653,693 May 63.93 Dec 20 A 99 A 2.0575 2.0520 20207 A 9047 .9015 .9059 .0010 .0009 2,490 161,102 .7507 .7518 -0001 1,031 141,631 Currency Futures Japanese Yen (CME)- 12,500,000: $ per 100 April .8998 .9016 .8992 June .9070 .9034 Canadian Dollar (CME)-CAD 1000,000: $ per CAD April .7508 .7508 .7505 June .7514 .7528 .7497 British Pound (CME)- 62,500: $ per 1.3054 1.3118 1.3052 June 1.3097 1.3165 1.3093 Swiss Franc (CME)-CHF 125,500; $ per CHF June 1.0067 1.0075 1.0030 Sept 1.0122 1.0130 1.0117 Australian Dollar (CME)-AUD 100,000; $ per AUD April .7164 .7116 May .7127 .7179 .7117 June 7133 7185 7120 April 1.3087 1.3128 .0041 .0041 815 139,407 038 -0031 1.0123 -.0032 74,074 48 May 917.00 .7116 .7167 .7171 7176 .0042 .0042 0042 255 312 144 937: May .001 95,014 .7507 .7518 0001 1,031 141,6311 1.75 553,142 2.25 556,095 1.3087 1.3128 0041 .0041 815 139,407 274.25 -2.25 -1.00 3,102 1,875 1.0038 -0031 1.0123 - 0032 74,074 48 917.00 3.25 3.50 267,825 261,722 Canadian Dollar (CME)-CAD 1000,000; $ per CAD April .7508 .7508 .7505 June .7514 .7528 .7497 British Pound (CME)- 62,500; $ per April 1.3054 1.3118 1.3052 June 1.3097 1.3165 1.3093 Swiss Franc (CME)-CHF 125,500; $ per CHF June 1.0067 1.0075 1.0030 Sept 1.0122 1.0130 1.0117 Australian Dollar (CME)-AUD 100,000: $ per AUD April .7116 .7164 .7116 May .7127 .7179 .7117 June .7133 .7185 .7120 Sept .7146 .7196 .7140 Dec .7176 .7187 .7176 March 20 .7172 .7172 .7163 Mexican Peso (CME)-MXN 500,000; $ per MXN April .05272 .05272 .05272 june .05226 .05259 .05222 Euro (CME)-125,000: $ per April 1.1271 1.1292 1.1241 1.1328 1.1360 1.1294 309.10 1.00 1.00 142,987 149,225 .7167 .7171 .7176 .7189 .7203 .7216 .0042 .0042 .0042 .0041 .0041 .0041 255 312 144,937 670 203 73 29.31 29.41 .03 127,952 .03 158,428 -5.50 -2.50 5,281 2,162 .05303.00026 .05251 .00026 39 234,619 -1.50 -2.50 158,124 171,832 .0003 1.1276 1.1336 2,387 478,245 June .0003 Wheat (KC)-5000 bu -1.25 117,401 -2.25 125,262 2.849 2.861 2.829 2.842 Agriculture Futures Corn (CBT)-5,000 bu.; cents per bu. May 360.25 362.75 360.00 361.75 July 368.75 371.75 368.75 370.75 Oats (CBT)-5,000 bu; cents per bu. May 282.00 282.00 277.00 279.00 274.75 July 269.75 272.75 Soybeans (CBT)-5,000 bus; cents per bu. May 903.75 897.25 902.00 July 911.50 910.25 915.25 Soybean Meal (CBT)-100 tons.; per ton. May 311.00 308.50 310.10 July 312.80 314.70 312.20 313.80 su Soybean Oil (CBT)-60,000 lbs.; cents per Ib. May 29.02 29.11 28.81 29.07 July 29.12 29.38 Rough Rice (CBT)-2000 cwf.: $ per cwb. . May 1032.00 1041.50 1021.50 1023.50 July 1059.00 1061.50 1042.00 1048.50 Wheat (CBT)-5000 bu., cents per bu. May 459.00 461.75 455.50 458.00 July 463.75 100. 464.75 460.00 461.50 bu; cents per bu. May 426.75 430.00 424.50 426.25 4322 July 433.50 436.25 431.50 432.75 wy Wheat (MPLS)-5000 bu., cents per bu. May 523.00 533.50 523.00 530.25 July 531.00 541.25 531.00 537.00 Cattle-Feeder (CME)-50,000 lbs.: cents per lb. April 145.850 145.925 145.00 145.175 Aug 156.450 157.025 Cattle-Live (CME) 40,000 lbs.; cents per lb. April 125.825 126.325 125.875 June 120.150 120.350 119.600 119.950 Hogs-Lean (CME)-40,000 lbs., cents per lb. April 78.750 79.125 78.675 78.900 June 94.000 97.325 93.525 96.450 ME Lumber (CME)-110,000 bd.ft. $ per 1,000 bd. ft. May 344.80 336.00 342.40 40 July 346.30 348.10 340.80 345.00 Milk (CME)-200,000 lbs., cents per Ib. April 15.94 15.99 A 15.87 15.97 May 15.84 15.96 A 15.84 15.92 Cocoa (ICE-US)-10 metrictons, $ per ton. May 2,439 2,449 may 2,421 2,443 July 2.418 ay 2,399 2,425 2,423 4+25 Coffee (ICE-US)-37,500 lbs; May 93.75 94.50 93.10 94.25 July 96.20 96.95 95.60 96.75 Sugar-World (ICE-US)-112,000 lbs; cents per lb. 2000 May 12.78 12.83 12.70 12.81 July 12.90 12.99 12.84 12.98 Sugar-Domestic (ICE-US)-112,000 lbs; cents per lb. July 26.99 27.00 26.99 27.00 Sept 26.65 26.96 26.65 27.10 26166 8 78,612 7.25 5.75 21,552 21,816 2894.50 11.90 28,438 -975 157.600 157.750 3,781 18,169 -.575 125.375 2894.50 2899.50 12.00 12.00 2,531,776 19,300 -.025 -.400 23,376 198,207 Index Futures Mini DJ Industrial Average (CBT)-$ 5 x index June 26144 26233 26107 S&P 500 Index (CME)-$250 x Index June 2883.00 2895.50 A 2883.00 Mini S&P 500 (CME)-$50 x Index June 2882.00 2895.75 2878.00 Sept 2887.75 2901.00 2883.50 Mini S&P Midcap 400 (CME) $100 x Index June 1932.20 1951.50 1929.00 Mini Nasdaq 100 (CME)-$20 x Index June 7590.5 7646.0 A 7575.8 Mini Russell 2000 (ICE-US)-$100 x Index June 1564.50 1586.80 1562.10 Mini Russell 1000 (ICE-US)-$100 x Index June 1599.70 1603.40 1598.40 US Dollar Index (ICE-US)-$1,000 x Index June 96.60 96.84 96.41 1949.40 18.30 63,577 .375 1.300 13,520 82,006 7641.3 48.0 200.115 342.30 2.40 .70 1,880 1,016 1585.80 21.10 435,857 .02 .07 3,396 3,878 1603.00 6.30 8,979 96.56 -.05 49.480 -3 5 21,910 88,143 Ibs: cents per lb. .60 .65 90,442 115, 156 .03 230,257 .08 299,402 .39 .44 2,759 2,456 1. Understanding Futures Quotations (L01, LO2, CFA2) Using Figure 14.1, answer the following questions: a. What was the settle price for July 2019 coffee futures on this date? What is the total dollar value of this contract at the close of trading for the day? b. What was the settle price for June 2019 gasoline futures on this date? If you held 10 contracts, what is the total dollar value of your futures position? c. Suppose you held an open position of 25 June 2019 Mini Dow Jones Industrial Average futures on this day. What is the change in the total dollar value of your position for this day's trading? If you held a long position, would this represent a profit or a loss to you? d. Suppose you are short 10 July 2019 soybean oil futures contracts. Would you have made a profit or a loss on this day? 2. Futures Profits and Losses (LO2, CFA2) You are long 20 July 2019 soybean futures contracts. (Grain traders would say you are long 100, i.e., 100,000 bushels.) Calculate your dollar profit or loss from this trading day using Figure 14.1. 3. Futures Profits and Losses (LO2, CFA2) You are short 15 July 2019 corn futures contracts. (Grain traders would say that you are short 75," i.e., 75,000 bushels.) Calculate your dollar profit or loss from this trading day using Figure 14.1. Open Interest Settle Chg Contract Open High hi lo Low Cotton (ICE-US)-50,000 lbs., cents per lb. May 78.18 78.35 77.32 July 78.73 78.84 78.09 Orange Juice (ICE-US)-15,000 lbs.; cents per lb. May 108.90 109.80 108.20 July 113.70 114.35 111.85 77.62 78.46 -.47 -.01 51,151 81.051 108.60 112.20 -.80 -1.95 10,496 7,078 Feb 20 Futures Contracts WSJ.com/commodities Metal & Petroleum Futures Contract Open Open High hilo Low Settle Chg Interest Copper-High (CMX)-25,000 lbs.; $ per lb. April 2.9225 -0.0090 1,264 May 2.9325 2.9425 2.9110 2.9255 -0.0085 92,345 Gold (CMX)-100 troy oz.: $ per troy oz. April 1304.00 1304.00 1301.50 1309.10 5.60 325 June June 1308.20 1314.70 1304.70 1313.90 5.60 331,311 Aug 1314.50 1320.70 1311.00 1319.90 5.60 50,769 Dec 1326.50 1332.20 1322.80 1331.90 5.60 36,080 1329.90 1337.90 1329.90 1337.90 5.50 11,597 April 1337.30 1343.10 1334.80 1343.60 5.50 6,985 Palladium (NYM)-50 troy oz.; $ per troy oz. April 1366.40 0.60 1 June 1362.60 1371.50 1355.00 1363.20 0.60 19,677 Sept 1356.40 1361.70 1349.20 1356.80 1.40 2.205 Platinum (NYM)-50 troy oz.: $ per troy oz. April 900.00 900.00 900.00 903.20 9.30 67 July 896.10 912.80 890.50 908.90 9.60 69,489 Silver (CMX)-5.000 troy oz: $ per troy oz. April 15.170 15.205 15.095 15.201 0.033 16 May 15.185 15.265 15.115 15.244 0.033 117.796 Crude Oil, Light Sweet (NYM)-1000 bbls.; $ per bbl. 64.22 64.70 64.05 64.61 0.63 280,173 June 64.20 64.71 A 64.01 64.65 0.69 321,402 July 64.12 64.69 A 64.67 0.76 189,217 Sept 63.72 64.40 A CE 63.55 64.38 14 0.82 154,891 Dec 62.73 63.47 CE 62.57 63.46 0.84 199,537 58.73 59.29 58.68 30.00 59.28 0.56 118,733 NY Harbor ULSD (NYM)-42,000 gal: $ per gal. May 2.0510 2.0897 A 2.0488 2.0876 .0427 90,825 June 2.0910 A 2.0892 .0412 79.735 Gasoline-NY RBOB (NYM)-42,000 gal.; $ per gal. May 2.0105 2.0702 A 2.0105 2.0692 .0702 108,354 June 1.9850 2.0307 1.9806 2.0297 .0598 103.754 Natural Gas (NYM)-10,000 MMBtu.; $ per MMBtu. May 2.705 2.729 way 2.686 2.700 .001 187,831 June 2.749 2.768 2.726 2.742 .003 167,629 July 2.805 2.824 2.786 2.801 .003 125.844 Aug 2.832 2.849 2.813 2.827 .001 71,485 Sept 2.827 2.843 2.808 2.821 144,545 Oct 2.849 2.861 2.829 2.842 .001 95,014 Agriculture Futures Corn (CBT)-5,000 bu.: cents per bu. May 360.25 362.75 360.00 361.75 1.75 553,142 July 368.75 371.75 368.75 370.75 2.25 556,095 Oats (CBT)-5,000 bu.; cents per bu. May 282.00 282.00 277.00 279.00 -2.25 3.102 July 274.25 274.75 269.75 272.75 -1.00 1,875 Soybeans (CBT)-5,000 bu.; cents per bu. 898.75 903.75 897.25 902.00 3.25 267,825 July 911.50 910.25 915.25 3.50 261,722 Soybean Meal (CBT)-100 tons.; per ton. 309.10 311.00 308.50 310.10 1.00 142,987 Interest Rate Futures Treasury Bonds (CBT)-$100,000; pts 32nds of 100% June 147-280 148-170 147-230 148-070 7.0 941,582 Treasury Notes (CBT)-$100,000; pts 32nds of 100% June 123-190 123-295 123-170 123-255 5.0 3.920,906 Sept 123-305 124-040 123-270 124-015 6.0 2,121 5 Yr. Treasury Notes (CBT)-$100,000; pts 32nds of 100% June 115-160 115-230 115-147 115-202 3.5 4,272,721 Sept 115-220 115-252 115-202 115-240 4.0 41,922 2 Yr. Treasury Notes (CBT) $200,000; pts 32nds of 100% June 106-123 106-147 106-122 106-136 1.0 3,407,265 30 Day Federal Funds (CBT)-$5,000,000:100-daily avg. April 97.590 97.593 97.590 97.590 -.002 222.888 May 97.600 97.600 97.595 97.595 -.005 264,957 10 Yr. Del. Int. Rate Swaps (CBT)-$100,000; pts 32nds of 100% June 104.406 104.797 104.406 104.641 .188 19,922 1 Month Libor (CME) $1300,000; pts of 100% April 97.5225 15 Eurodollar (CME)-$1000,000; pts of 100% April 97.4275 97.4275 97.4100 97.4175 -0125 225,824 June 97.4450 97.4550 97.4400 97.4450 -.0050 1,459,756 Sept 97.4850 97.5050 97.4850 97.4950 1,385,215 Dec 97.5050 97.5350 97.5050 97.5200 .0050 1,653,693 May 63.93 Dec 20 A 99 A 2.0575 2.0520 20207 A 9047 .9015 .9059 .0010 .0009 2,490 161,102 .7507 .7518 -0001 1,031 141,631 Currency Futures Japanese Yen (CME)- 12,500,000: $ per 100 April .8998 .9016 .8992 June .9070 .9034 Canadian Dollar (CME)-CAD 1000,000: $ per CAD April .7508 .7508 .7505 June .7514 .7528 .7497 British Pound (CME)- 62,500: $ per 1.3054 1.3118 1.3052 June 1.3097 1.3165 1.3093 Swiss Franc (CME)-CHF 125,500; $ per CHF June 1.0067 1.0075 1.0030 Sept 1.0122 1.0130 1.0117 Australian Dollar (CME)-AUD 100,000; $ per AUD April .7164 .7116 May .7127 .7179 .7117 June 7133 7185 7120 April 1.3087 1.3128 .0041 .0041 815 139,407 038 -0031 1.0123 -.0032 74,074 48 May 917.00 .7116 .7167 .7171 7176 .0042 .0042 0042 255 312 144 937: May .001 95,014 .7507 .7518 0001 1,031 141,6311 1.75 553,142 2.25 556,095 1.3087 1.3128 0041 .0041 815 139,407 274.25 -2.25 -1.00 3,102 1,875 1.0038 -0031 1.0123 - 0032 74,074 48 917.00 3.25 3.50 267,825 261,722 Canadian Dollar (CME)-CAD 1000,000; $ per CAD April .7508 .7508 .7505 June .7514 .7528 .7497 British Pound (CME)- 62,500; $ per April 1.3054 1.3118 1.3052 June 1.3097 1.3165 1.3093 Swiss Franc (CME)-CHF 125,500; $ per CHF June 1.0067 1.0075 1.0030 Sept 1.0122 1.0130 1.0117 Australian Dollar (CME)-AUD 100,000: $ per AUD April .7116 .7164 .7116 May .7127 .7179 .7117 June .7133 .7185 .7120 Sept .7146 .7196 .7140 Dec .7176 .7187 .7176 March 20 .7172 .7172 .7163 Mexican Peso (CME)-MXN 500,000; $ per MXN April .05272 .05272 .05272 june .05226 .05259 .05222 Euro (CME)-125,000: $ per April 1.1271 1.1292 1.1241 1.1328 1.1360 1.1294 309.10 1.00 1.00 142,987 149,225 .7167 .7171 .7176 .7189 .7203 .7216 .0042 .0042 .0042 .0041 .0041 .0041 255 312 144,937 670 203 73 29.31 29.41 .03 127,952 .03 158,428 -5.50 -2.50 5,281 2,162 .05303.00026 .05251 .00026 39 234,619 -1.50 -2.50 158,124 171,832 .0003 1.1276 1.1336 2,387 478,245 June .0003 Wheat (KC)-5000 bu -1.25 117,401 -2.25 125,262 2.849 2.861 2.829 2.842 Agriculture Futures Corn (CBT)-5,000 bu.; cents per bu. May 360.25 362.75 360.00 361.75 July 368.75 371.75 368.75 370.75 Oats (CBT)-5,000 bu; cents per bu. May 282.00 282.00 277.00 279.00 274.75 July 269.75 272.75 Soybeans (CBT)-5,000 bus; cents per bu. May 903.75 897.25 902.00 July 911.50 910.25 915.25 Soybean Meal (CBT)-100 tons.; per ton. May 311.00 308.50 310.10 July 312.80 314.70 312.20 313.80 su Soybean Oil (CBT)-60,000 lbs.; cents per Ib. May 29.02 29.11 28.81 29.07 July 29.12 29.38 Rough Rice (CBT)-2000 cwf.: $ per cwb. . May 1032.00 1041.50 1021.50 1023.50 July 1059.00 1061.50 1042.00 1048.50 Wheat (CBT)-5000 bu., cents per bu. May 459.00 461.75 455.50 458.00 July 463.75 100. 464.75 460.00 461.50 bu; cents per bu. May 426.75 430.00 424.50 426.25 4322 July 433.50 436.25 431.50 432.75 wy Wheat (MPLS)-5000 bu., cents per bu. May 523.00 533.50 523.00 530.25 July 531.00 541.25 531.00 537.00 Cattle-Feeder (CME)-50,000 lbs.: cents per lb. April 145.850 145.925 145.00 145.175 Aug 156.450 157.025 Cattle-Live (CME) 40,000 lbs.; cents per lb. April 125.825 126.325 125.875 June 120.150 120.350 119.600 119.950 Hogs-Lean (CME)-40,000 lbs., cents per lb. April 78.750 79.125 78.675 78.900 June 94.000 97.325 93.525 96.450 ME Lumber (CME)-110,000 bd.ft. $ per 1,000 bd. ft. May 344.80 336.00 342.40 40 July 346.30 348.10 340.80 345.00 Milk (CME)-200,000 lbs., cents per Ib. April 15.94 15.99 A 15.87 15.97 May 15.84 15.96 A 15.84 15.92 Cocoa (ICE-US)-10 metrictons, $ per ton. May 2,439 2,449 may 2,421 2,443 July 2.418 ay 2,399 2,425 2,423 4+25 Coffee (ICE-US)-37,500 lbs; May 93.75 94.50 93.10 94.25 July 96.20 96.95 95.60 96.75 Sugar-World (ICE-US)-112,000 lbs; cents per lb. 2000 May 12.78 12.83 12.70 12.81 July 12.90 12.99 12.84 12.98 Sugar-Domestic (ICE-US)-112,000 lbs; cents per lb. July 26.99 27.00 26.99 27.00 Sept 26.65 26.96 26.65 27.10 26166 8 78,612 7.25 5.75 21,552 21,816 2894.50 11.90 28,438 -975 157.600 157.750 3,781 18,169 -.575 125.375 2894.50 2899.50 12.00 12.00 2,531,776 19,300 -.025 -.400 23,376 198,207 Index Futures Mini DJ Industrial Average (CBT)-$ 5 x index June 26144 26233 26107 S&P 500 Index (CME)-$250 x Index June 2883.00 2895.50 A 2883.00 Mini S&P 500 (CME)-$50 x Index June 2882.00 2895.75 2878.00 Sept 2887.75 2901.00 2883.50 Mini S&P Midcap 400 (CME) $100 x Index June 1932.20 1951.50 1929.00 Mini Nasdaq 100 (CME)-$20 x Index June 7590.5 7646.0 A 7575.8 Mini Russell 2000 (ICE-US)-$100 x Index June 1564.50 1586.80 1562.10 Mini Russell 1000 (ICE-US)-$100 x Index June 1599.70 1603.40 1598.40 US Dollar Index (ICE-US)-$1,000 x Index June 96.60 96.84 96.41 1949.40 18.30 63,577 .375 1.300 13,520 82,006 7641.3 48.0 200.115 342.30 2.40 .70 1,880 1,016 1585.80 21.10 435,857 .02 .07 3,396 3,878 1603.00 6.30 8,979 96.56 -.05 49.480 -3 5 21,910 88,143 Ibs: cents per lb. .60 .65 90,442 115, 156 .03 230,257 .08 299,402 .39 .44 2,759 2,456