

Answered step by step
Verified Expert Solution
Question
1 Approved Answer
1. Use the cash flow diagram to determine the uniform annual amount in years 1 through 8 that is equivalent to all of the cash
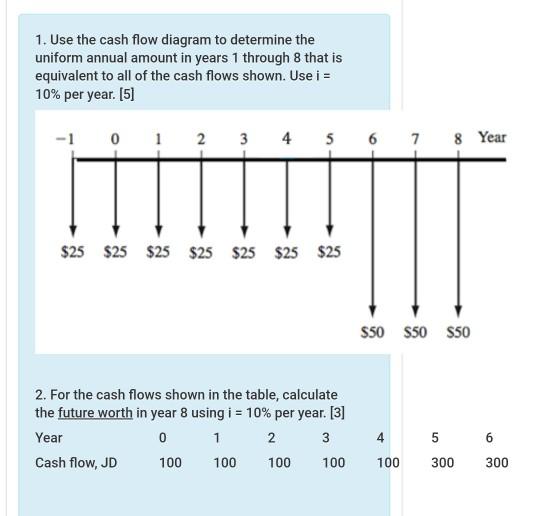
1. Use the cash flow diagram to determine the uniform annual amount in years 1 through 8 that is equivalent to all of the cash flows shown. Use i = 10% per year. [5] 0 1 2 3 4 5 6 7 8 Year $25 $25 $25 $25 $25 $25 $25 $50 S50 550 2. For the cash flows shown in the table, calculate the future worth in year 8 using i = 10% per year. [3] Year 0 1 2 3 Cash flow, JD 100 100 4 5 6 100 100 100 300 300
Step by Step Solution
There are 3 Steps involved in it
Step: 1

Get Instant Access to Expert-Tailored Solutions
See step-by-step solutions with expert insights and AI powered tools for academic success
Step: 2

Step: 3
Ace Your Homework with AI
Get the answers you need in no time with our AI-driven, step-by-step assistance
Get Started
Essentials Of Applied Econometrics
Authors: Aaron D Smith, J Edward Taylor
1st Edition
0520288335, 9780520288331