1. Use the companys last 5 years (2016-2020) financial data to estimate the companys free cash flows for each of these years. (5 marks)
A useful formula: FCF = EBIT(1-T) + Depreciation and Amortization - in net working capital - Capital expenditure
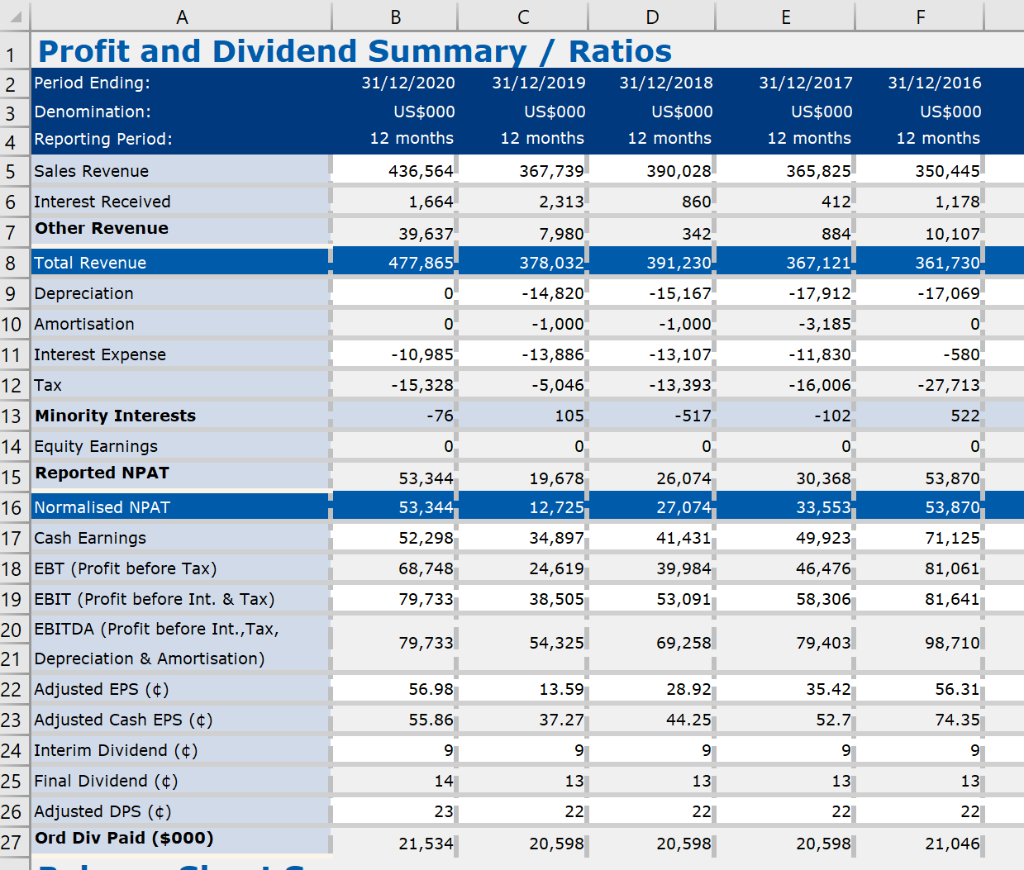
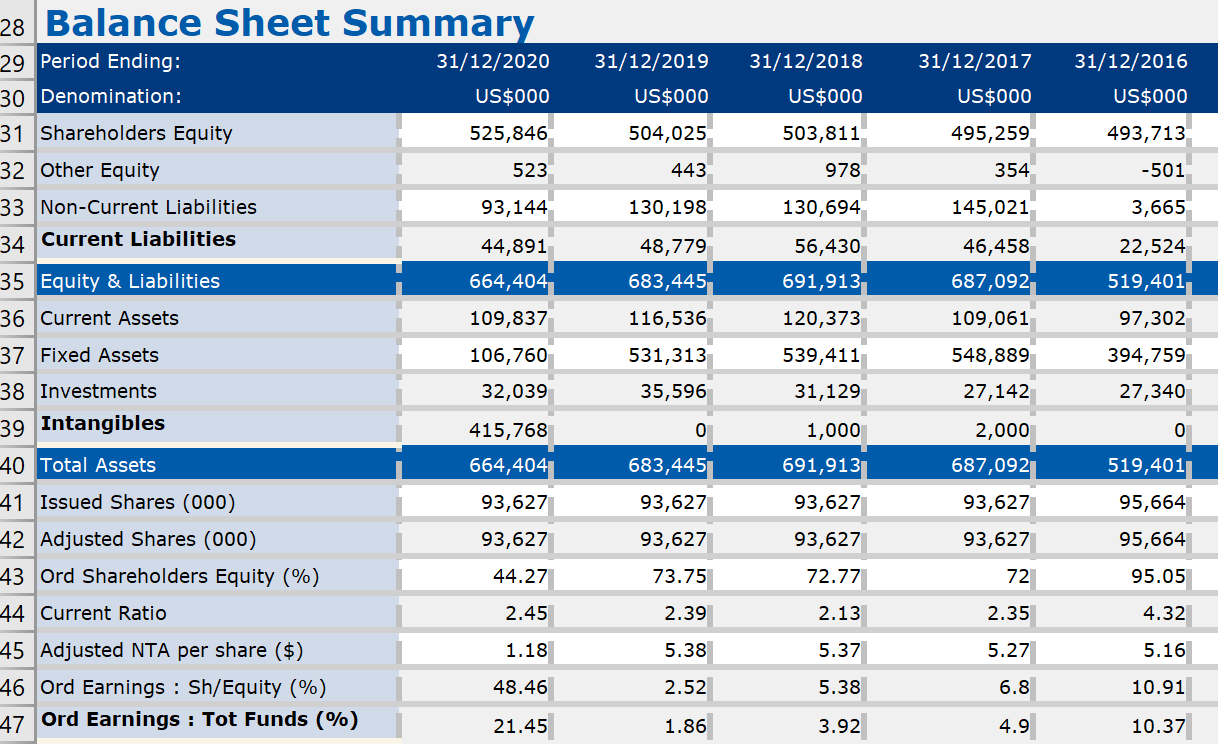
E F 31/12/2017 US$000 12 months 31/12/2016 US$000 12 months 365,825 350,445 412 1,178 884 10,107 361,730 367,121 -17,912 -3,185 -17,069 0 -11,830 -580 -16,006 -27,713 -76 -517 -102 522 B D 1 Profit and Dividend Summary / Ratios 2 Period Ending: 31/12/2020 31/12/2019 31/12/2018 3 Denomination: US$000 US$000 US$000 4 Reporting Period: 12 months 12 months 12 months 5 Sales Revenue 436,564 367,739 390,028 6 Interest Received 1,664 2,313 860 7 Other Revenue 39,637 7,980 342 8 Total Revenue 477,865 378,032 391,230 9 Depreciation 0 -14,820 -15,167 10 Amortisation 0 -1,000 -1,000 11 Interest Expense -10,985 -13,886 -13,107 12 Tax -15,328 -5,046 -13,393 13 Minority Interests 105 14 Equity Earnings 0 0 0 15 Reported NPAT 53,344 19,678 26,074 16 Normalised NPAT 53,344 12,725 27,074 17 Cash Earnings 52,298 34,897 41,431 18 EBT (Profit before Tax) 68,748 24,619 39,984 19 EBIT (Profit before Int. & Tax) 79,733 38,505 53,091 20 EBITDA (Profit before Int., Tax, 79,733 54,325 69,258 21 Depreciation & Amortisation) 22 Adjusted EPS () 56.98 13.59 28.92 23 Adjusted Cash EPS () 55.86 37.27 44.25 24 Interim Dividend () 9 9 9 25 Final Dividend () 14 13 13 26 Adjusted DPS ($) 23 22 22 27 Ord Div Paid ($000) 21,534 20,598 20,598 0 0 30,368 33,553 49,923 53,870 53,870 71,125 81,061 46,476 58,306 81,641 79,403 98,710 35.42 56.31 52.7 74.35 9 9 13 13 22 22 21,046 20,598 28 Balance Sheet Summary 31/12/2020 US$000 31/12/2019 US$000 31/12/2018 US$000 31/12/2017 US$000 31/12/2016 US$000 525,846 504,025 503,811 495,259 493,713 523 443 978 354 -501 93,144 130,198 130,694 145,021 3,665 29 Period Ending: 30 Denomination: 31 Shareholders Equity 32 Other Equity 33 Non-Current Liabilities 34 Current Liabilities 35 Equity & Liabilities 36 Current Assets 37 Fixed Assets 38 Investments 39 Intangibles 44,891 664,404 109,837 48,779 683,445 56,430 691,913 46,458 687,092 22,524 519,401 116,536 120,373 97,302 539,411 106,760 32,039 531,313 35,596 109,061 548,889 27,142 394,759 27,340 31,129 0 1,000 0 415,768 664,404 683,4451 691,913 2,000 687,092 93,627 519,401] 93,627 93,627 95,664 40 Total Assets 41 Issued Shares (000) 42 Adjusted Shares (000) 43 Ord Shareholders Equity (%) 44 Current Ratio 93,627 93,627 93,627 93,627 95,664 93,627 72 44.27 73.75 72.77 95.05 2.45 2.39 2.13 2.35 4.32 1.18 5.38 5.37 5.27 5.16 45 Adjusted NTA per share ($) 46 Ord Earnings : Sh/Equity (%) 47 Ord Earnings : Tot Funds (%) 48.46 2.52 5.38 6.8 10.91 21.45 1.86 3.92 4.9 10.37