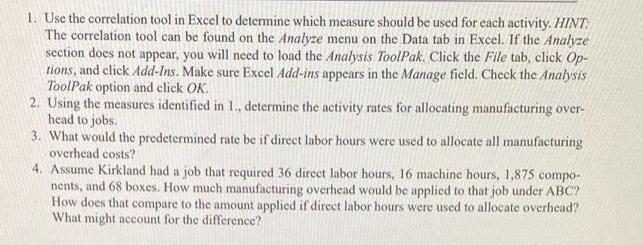
1. Use the correlation tool in Excel to determine which measure should be used for each activity. HINT: The correlation tool can be found


1. Use the correlation tool in Excel to determine which measure should be used for each activity. HINT: The correlation tool can be found on the Analyze menu on the Data tab in Excel. If the Analyze section does not appear, you will need to load the Analysis ToolPak. Click the File tab, click Op- tions, and click Add-Ins. Make sure Excel Add-ins appears in the Manage field. Check the Analysis ToolPak option and click OK. 2. Using the measures identified in 1., determine the activity rates for allocating manufacturing over- head to jobs. 3. What would the predetermined rate be if direct labor hours were used to allocate all manufacturing overhead costs? 4. Assume Kirkland had a job that required 36 direct labor hours, 16 machine hours, 1,875 compo- nents, and 68 boxes. How much manufacturing overhead would be applied to that job under ABC? How does that compare to the amount applied if direct labor hours were used to allocate overhead? What might account for the difference? Budgeted Overhead Materials movement. Assembly. Packaging/Shipping. $1,080,000 $1,950,000 $1,584,000 Budgeted Measures # of jobs Direct labor hours.. Machine hours # of boxes shipped. # of components used 480 16,000 7,800 48,000 4,000,000
Step by Step Solution
3.43 Rating (150 Votes )
There are 3 Steps involved in it
Step: 1
A Statement showing activity drivers and rates A B C D E BD Particu...
See step-by-step solutions with expert insights and AI powered tools for academic success
Step: 2

Step: 3

Ace Your Homework with AI
Get the answers you need in no time with our AI-driven, step-by-step assistance
Get Started


