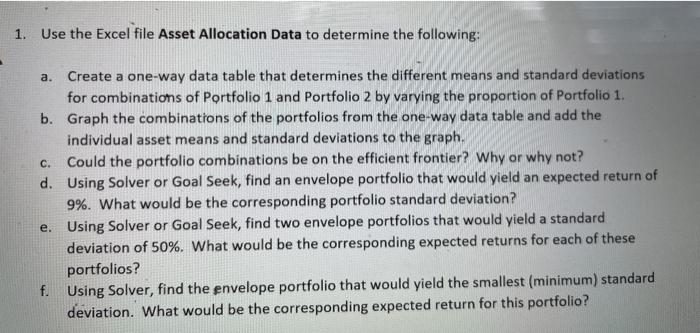
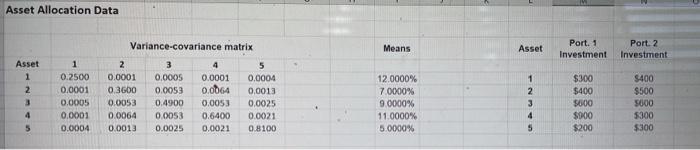
1. Use the Excel file Asset Allocation Data to determine the following: a. C. Create a one-way data table that determines the different means and standard deviations for combinations of Portfolio 1 and Portfolio 2 by varying the proportion of Portfolio 1. b. Graph the combinations of the portfolios from the one-way data table and add the individual asset means and standard deviations to the graph, Could the portfolio combinations be on the efficient frontier? Why or why not? d. Using Solver or Goal Seek, find an envelope portfolio that would yield an expected return of 9%. What would be the corresponding portfolio standard deviation? e. Using Solver or Goal Seek, find two envelope portfolios that would yield a standard deviation of 50%. What would be the corresponding expected returns for each of these portfolios? f. Using Solver, find the envelope portfolio that would yield the smallest (minimum) standard deviation. What would be the corresponding expected return for this portfolio? Asset Allocation Data Variance-covariance matrix Means Asset Port. 1 Investment Port 2 Investment Asset 1 2 WN- 0.2500 0.0001 0.0005 0.0001 0.0004 2 0.0001 0.3600 0.0053 0.0064 0.0013 0.0005 0.0053 0.4900 0.0053 0.0025 4 0.0001 0.0064 0.0053 0.6400 0.0021 5 0.0004 0,0013 0.0025 0.0021 0.8100 12.0000% 7.0000% 9.0000% 11.0000% 5.0000% 1 2 3 4 5 $300 $400 5000 $900 $200 $400 $500 5000 $300 $300 4 5 1. Use the Excel file Asset Allocation Data to determine the following: a. C. Create a one-way data table that determines the different means and standard deviations for combinations of Portfolio 1 and Portfolio 2 by varying the proportion of Portfolio 1. b. Graph the combinations of the portfolios from the one-way data table and add the individual asset means and standard deviations to the graph, Could the portfolio combinations be on the efficient frontier? Why or why not? d. Using Solver or Goal Seek, find an envelope portfolio that would yield an expected return of 9%. What would be the corresponding portfolio standard deviation? e. Using Solver or Goal Seek, find two envelope portfolios that would yield a standard deviation of 50%. What would be the corresponding expected returns for each of these portfolios? f. Using Solver, find the envelope portfolio that would yield the smallest (minimum) standard deviation. What would be the corresponding expected return for this portfolio? Asset Allocation Data Variance-covariance matrix Means Asset Port. 1 Investment Port 2 Investment Asset 1 2 WN- 0.2500 0.0001 0.0005 0.0001 0.0004 2 0.0001 0.3600 0.0053 0.0064 0.0013 0.0005 0.0053 0.4900 0.0053 0.0025 4 0.0001 0.0064 0.0053 0.6400 0.0021 5 0.0004 0,0013 0.0025 0.0021 0.8100 12.0000% 7.0000% 9.0000% 11.0000% 5.0000% 1 2 3 4 5 $300 $400 5000 $900 $200 $400 $500 5000 $300 $300 4 5