

Answered step by step
Verified Expert Solution
Question
1 Approved Answer
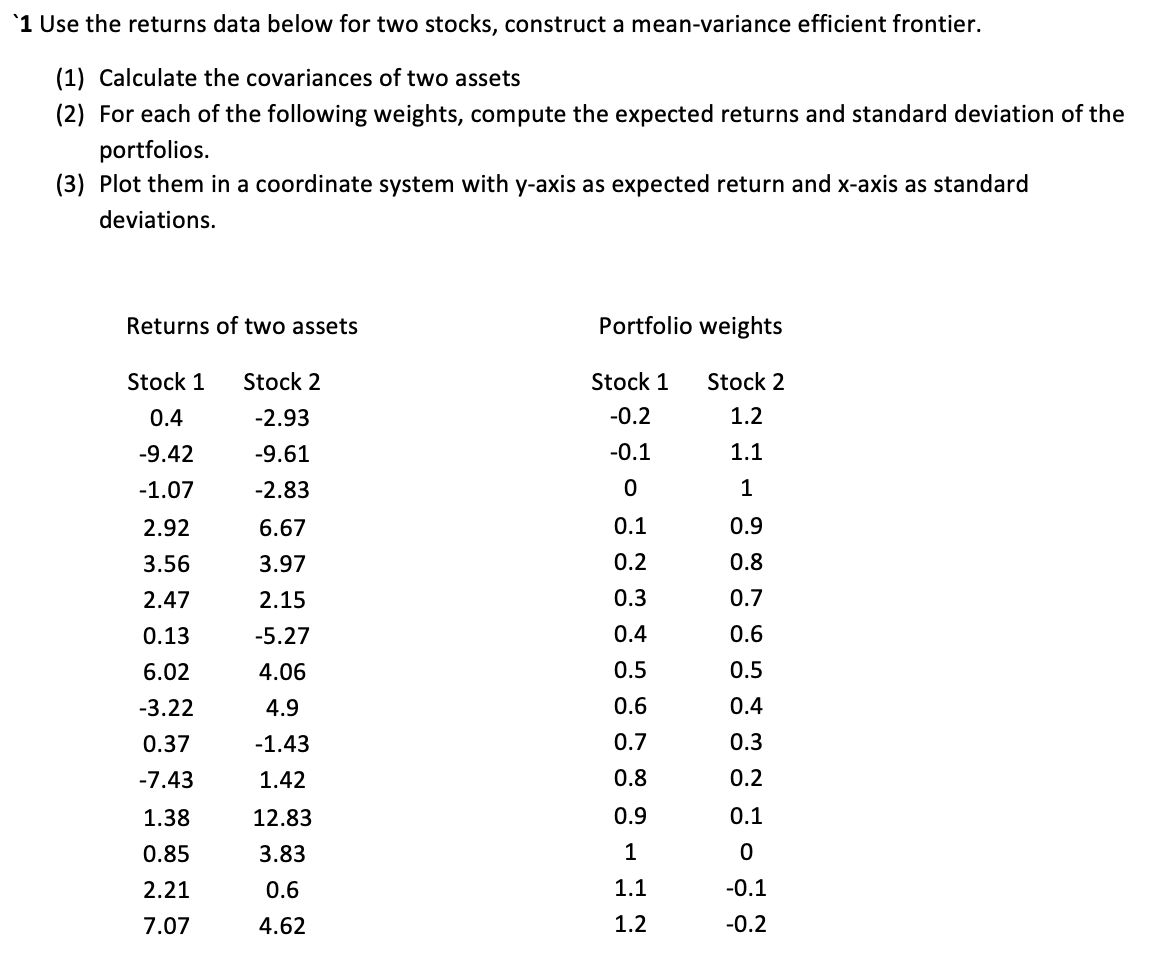
^1 Use the returns data below for two stocks, construct a mean-variance efficient frontier. (1) Calculate the covariances of two assets (2) For each of
Step by Step Solution
There are 3 Steps involved in it
Step: 1

Get Instant Access to Expert-Tailored Solutions
See step-by-step solutions with expert insights and AI powered tools for academic success
Step: 2

Step: 3
Ace Your Homework with AI
Get the answers you need in no time with our AI-driven, step-by-step assistance
Get Started
International Business Competing In The Global Marketplace
Authors: Charles Hill
14th Edition
1260387542, 9781260387544