

Question 2 (Time-series forecasting) 1. (3 points) Dummy variables corresponding to first, second, and third quarters were added to the linear trend model. These
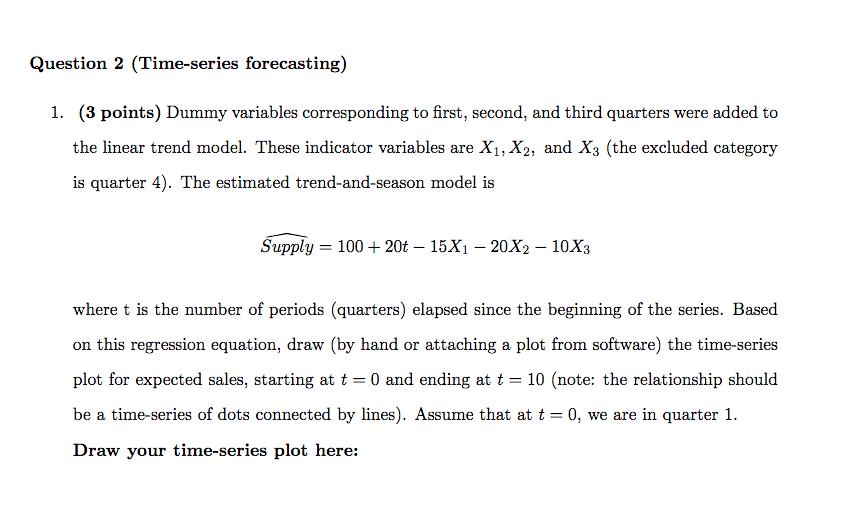
Question 2 (Time-series forecasting) 1. (3 points) Dummy variables corresponding to first, second, and third quarters were added to the linear trend model. These indicator variables are X1, X2, and X3 (the excluded category is quarter 4). The estimated trend-and-season model is Supply 100+ 20t-15X120X2 - 10X3 where t is the number of periods (quarters) elapsed since the beginning of the series. Based on this regression equation, draw (by hand or attaching a plot from software) the time-series plot for expected sales, starting at t= 0 and ending at t = 10 (note: the relationship should be a time-series of dots connected by lines). Assume that at t = 0, we are in quarter 1. Draw your time-series plot here:
Step by Step Solution
There are 3 Steps involved in it
Step: 1
stepbystep to create the timeseries plot for the given model textSupply 100 20t 15X1 20X2 10X3 Stepb... View full answer

Get step-by-step solutions from verified subject matter experts
100% Satisfaction Guaranteed-or Get a Refund!
Step: 2Unlock detailed examples and clear explanations to master concepts

Step: 3Unlock to practice, ask and learn with real-world examples
See step-by-step solutions with expert insights and AI powered tools for academic success
-
 Access 30 Million+ textbook solutions.
-
Ask unlimited questions from AI Tutors.
-
Order free textbooks.
-
100% Satisfaction Guaranteed-or Get a Refund!
Claim Your Hoodie Now!

Authors: John J. Coyle, Robert A. Novak, Brian Gibson, Edward J. Bard
8th edition
9781305445352, 1133592961, 130544535X, 978-1133592969

Study Smart with AI Flashcards
Access a vast library of flashcards, create your own, and experience a game-changing transformation in how you learn and retain knowledge
Explore Flashcards

