Answered step by step
Verified Expert Solution
Question
1 Approved Answer
1. Using MATLAB, Create a vector x of samples of a sinusoidal signal (use cosine wave) with A1 = 100, 1 = 2n (800),

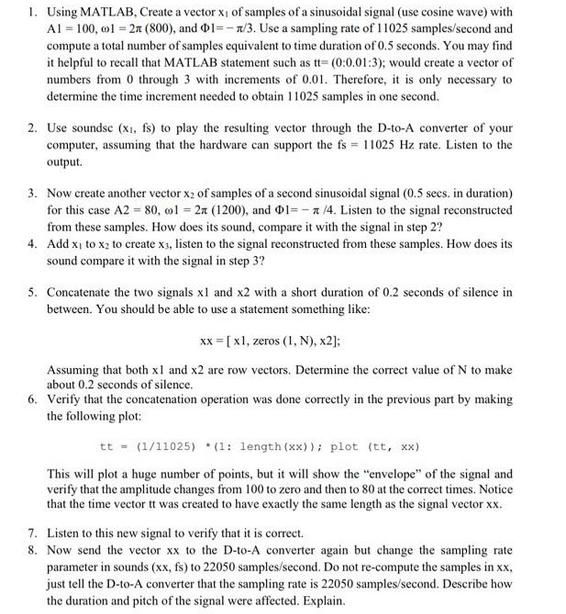
1. Using MATLAB, Create a vector x of samples of a sinusoidal signal (use cosine wave) with A1 = 100, 1 = 2n (800), and 1=-/3. Use a sampling rate of 11025 samples/second and compute a total number of samples equivalent to time duration of 0.5 seconds. You may find it helpful to recall that MATLAB statement such as tt- (0:0.01:3); would create a vector of numbers from 0 through 3 with increments of 0.01. Therefore, it is only necessary to determine the time increment needed to obtain 11025 samples in one second. 2. Use soundse (x, fs) to play the resulting vector through the D-to-A converter of your computer, assuming that the hardware can support the fs = 11025 Hz rate. Listen to the output. 3. Now create another vector x2 of samples of a second sinusoidal signal (0.5 secs. in duration) for this case A2 = 80, col=2z (1200), and 1=-a/4. Listen to the signal reconstructed from these samples. How does its sound, compare it with the signal in step 2? 4. Add x to x2 to create x3, listen to the signal reconstructed from these samples. How does its sound compare it with the signal in step 3? 5. Concatenate the two signals xl and x2 with a short duration of 0.2 seconds of silence in between. You should be able to use a statement something like: xx = [x1, zeros (1, N), x2]; Assuming that both xl and x2 are row vectors. Determine the correct value of N to make about 0.2 seconds of silence. 6. Verify that the concatenation operation was done correctly in the previous part by making the following plot: tt = (1/11025) (1: length (xx)); plot (tt, xx) This will plot a huge number of points, but it will show the "envelope" of the signal and verify that the amplitude changes from 100 to zero and then to 80 at the correct times. Notice that the time vector tt was created to have exactly the same length as the signal vector xx. 7. Listen to this new signal to verify that it is correct. 8. Now send the vector xx to the D-to-A converter again but change the sampling rate parameter in sounds (xx, fs) to 22050 samples/second. Do not re-compute the samples in xx, just tell the D-to-A converter that the sampling rate is 22050 samples/second. Describe how the duration and pitch of the signal were affected. Explain.
Step by Step Solution
There are 3 Steps involved in it
Step: 1
The below is the MATLAB code to perform the tasks described 1 Create vector x1 fs 11025 Sampling rat...
Get Instant Access to Expert-Tailored Solutions
See step-by-step solutions with expert insights and AI powered tools for academic success
Step: 2

Step: 3

Ace Your Homework with AI
Get the answers you need in no time with our AI-driven, step-by-step assistance
Get Started


