

Question
1. Using only the statement of financial position, calculate the percentage of the largest current liability account to total liabilities for 2018. Record your answer
 1. Using only the statement of financial position, calculate the percentage of the largest current liability account to total liabilities for 2018. Record your answer in percentage format and round to two decimals.
2. Compute the quick ratio for 2018. If there are derivative assets, treat them as a quick asset. Round your answer to the fourth decimal place
3.Compute the accounts payables turnover ratio for 2018 and 2017. Use cost of sales in your calculation. Round your answer to two decimals
4.What is the percentage of the largest non-current liabilities account to total liabilities for 2018? Record your answer in percentage format and round your answer to two decimal places.
5.
Has the Company issued any long-term bonds or notes in 2018? If so, read the note related to long-term debt, name one feature that a newly issued bond or note has (e.g., callable, convertible, unsecured, secured by specific collateral).
| There were no new issuances in 2018 | |
| Promissory notes | |
| Floating rate note, redeemable at the issuers option | |
| Senior notes, Subordinated notes |
6.Compute the debt-to-equity ratio for 2018. Round your answer to the fourth decimal
7.What is the quality of earnings ratio for 2018? (Round your answer to the second decimal).
8.What amount of cash was paid to common shareholders in the form of dividends in 2018?
9.How much cash did the Company pay for interest during 2018?
10.
What effect did the change in receivables have on the calculation of cash flows from operations for 2018? (2 marks)
There was a decrease in receivables which equates to an increase to net earnings when calculating cash flows from operations.
There was a decrease in receivables which equates to a decrease to net earnings when calculating cash flows from operations.
There was an increase in receivables which equates to a decrease to net earnings when calculating cash flows from operations.
There was an increase in receivables which equates to an increase to net earnings when calculating cash flows from operations.
11.Did the Company repurchase common shares during the most recent year? If so, how many shares were repurchased? (if none were purchased write 0 as the answer)?
12.Using the Companys financial statements and related notes, compute the return on assets ratio for 2018
13.Compute the times interest earned ratio for 2018. Round your answer to the second decimal.
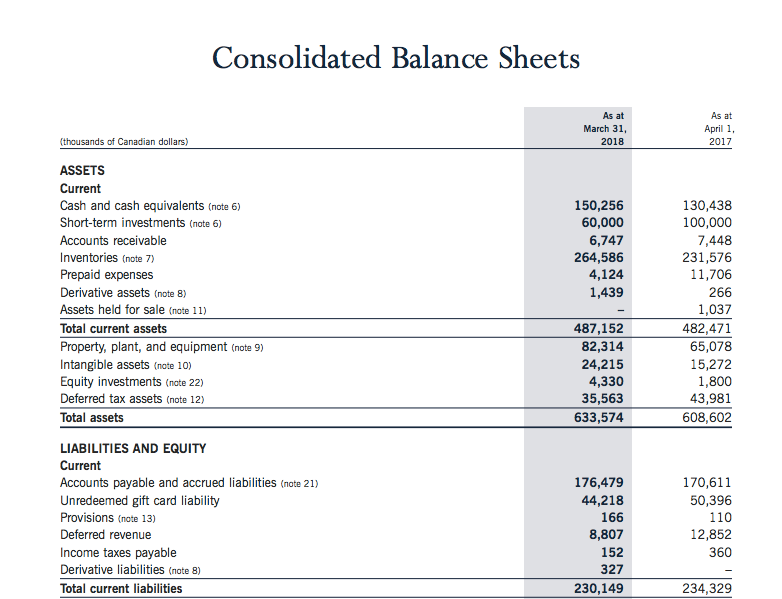
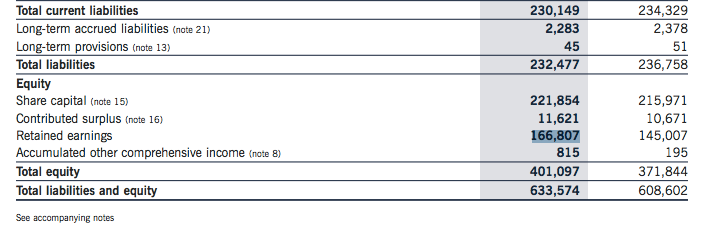
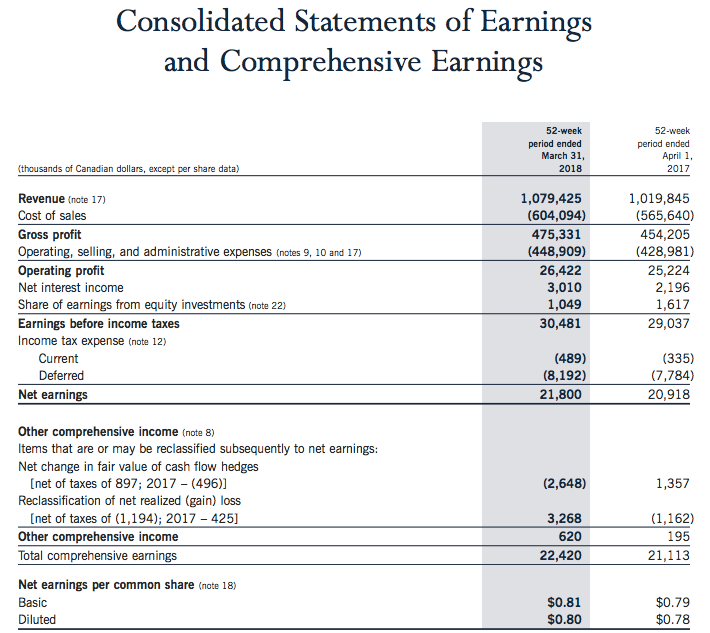
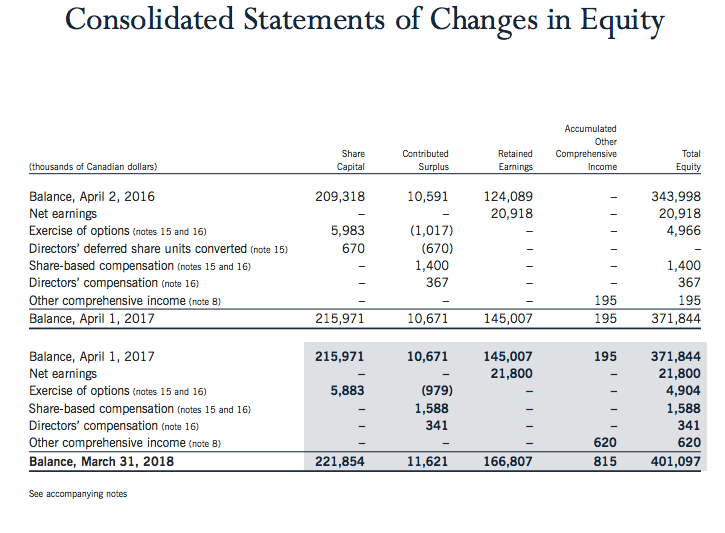
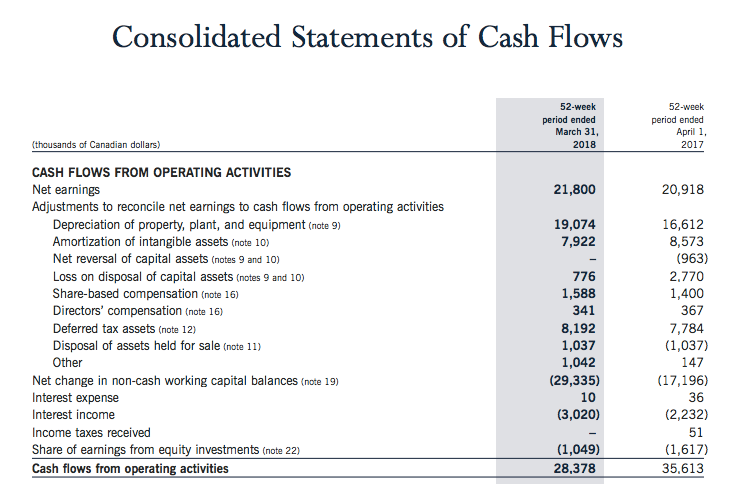
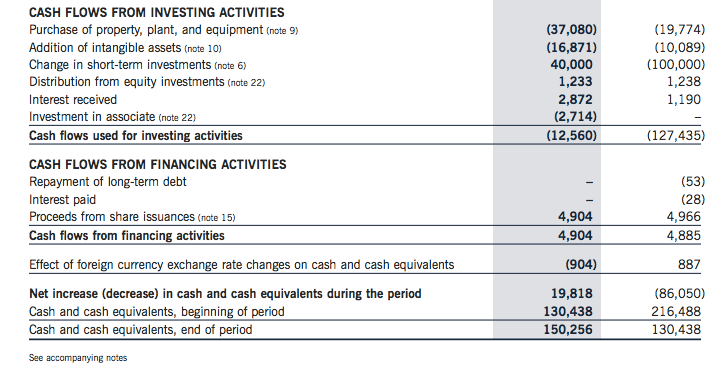
Consolidated Balance Sheets As at March 31, 2018 As at April 1. 2017 (thousands of Canadian dollars) ASSETS Current Cash and cash equivalents (note 6) Short-term investments (note 6) Accounts receivable Inventories (note 7) Prepaid expenses Derivative assets (note 8) Assets held for sale (note 11) Total current assets Property, plant, and equipment (note 9) Intangible assets (note 10) Equity investments (note 22) Deferred tax assets (note 12) Total assets 150,256 60,000 6,747 264,586 4,124 1,439 130,438 100,000 7,448 231,576 11,706 266 1,037 482,471 65,078 15,272 1,800 43,981 608,602 487,152 82,314 24,215 4,330 35,563 633,574 LIABILITIES AND EQUITY Current Accounts payable and accrued liabilities (note 21) Unredeemed gift card liability Provisions (note 13) Deferred revenue Income taxes payable Derivative liabilities (note 8) Total current liabilities 176,479 44,218 166 8,807 152 327 230,149 170,611 50,396 110 12,852 360 234,329 234,329 230,149 2,283 45 232,477 2,378 236,758 Total current liabilities Long-term accrued liabilities (note 21) Long-term provisions (note 13) Total liabilities Equity Share capital (note 15) Contributed surplus (note 16) Retained earnings Accumulated other comprehensive income (note 8) Total equity Total liabilities and equity 221,854 11,621 166,807 815 401,097 633,574 215,971 10,671 145,007 195 371,844 608,602 See accompanying notes Consolidated Statements of Earnings and Comprehensive Earnings 52-week period ended March 31, 2018 52-week period ended April 1, 2017 (thousands of Canadian dollars, except per share data) Revenue (note 17) Cost of sales Gross profit Operating, selling, and administrative expenses (notes 9, 10 and 17) Operating profit Net interest income Share of earnings from equity investments (note 22) Earnings before income taxes Income tax expense (note 12) Current Deferred Net earnings 1,079,425 (604,094) 475,331 (448,909) 26,422 3,010 1.049 30,481 1,019,845 (565,640) 454,205 (428,981) 25,224 2,196 1,617 29,037 (489) (8,192) 21,800 (335) (7,784) 20,918 (2,648) 1,357 Other comprehensive income (note 8) Items that are or may be reclassified subsequently to net earnings: Net change in fair value of cash flow hedges (net of taxes of 897; 2017-(496)] Reclassification of net realized (gain) loss [net of taxes of (1,194); 2017 - 425] Other comprehensive income Total comprehensive earnings 3,268 620 22,420 (1,162) 195 21,113 Net earnings per common share (note 18) Basic Diluted $0.79 $0.81 $0.80 $0.78 Consolidated Statements of Changes in Equity Accumulated Other Comprehensive Income (thousands of Canadian dollars) Share Capital Contributed Surplus Retained Earnings Total Equity 209,318 10,591 124,089 20,918 343,998 20,918 4,966 5,983 670 Balance, April 2, 2016 Net earnings Exercise of options (notes 15 and 16) Directors' deferred share units converted (note 15) Share-based compensation (notes 15 and 16) Directors' compensation (note 16) Other comprehensive income (note 8) Balance, April 1, 2017 (1,017) (670) 1,400 367 195 1,400 367 195 371,844 215,971 10,671 145,007 195 215,971 195 145,007 21,800 5,883 Balance, April 1, 2017 Net earnings Exercise of options (notes 15 and 16) Share-based compensation (notes 15 and 16) Directors' compensation (note 16) Other comprehensive income (note 8) Balance, March 31, 2018 10,671 - (979) 1,588 341 371,844 21,800 4,904 1,588 341 620 401,097 620 815 221,854 11,621 166,807 See accompanying notes Consolidated Statements of Cash Flows 52-week period ended March 31, 2018 52-week period ended April 1. 2017 (thousands of Canadian dollars) 21,800 20,918 19,074 7,922 CASH FLOWS FROM OPERATING ACTIVITIES Net earnings Adjustments to reconcile net earnings to cash flows from operating activities Depreciation of property, plant, and equipment (note 9) Amortization of intangible assets (note 10) Net reversal of capital assets (notes 9 and 10) Loss on disposal of capital assets (notes 9 and 10) Share-based compensation (note 16) Directors' compensation (note 16) Deferred tax assets (note 12) Disposal of assets held for sale (note 11) Other Net change in non-cash working capital balances (note 19) Interest expense Interest income Income taxes received Share of earnings from equity investments (note 22) Cash flows from operating activities 776 1,588 341 8,192 1,037 1,042 (29,335) 10 (3,020) 16,612 8,573 (963) 2.770 1,400 367 7,784 (1,037) 147 (17,196) 36 (2,232) 51 (1,617) 35,613 (1,049) 28,378 CASH FLOWS FROM INVESTING ACTIVITIES Purchase of property, plant, and equipment (note 9) Addition of intangible assets (note 10) Change in short-term investments (note 6) Distribution from equity investments (note 22) Interest received Investment in associate (note 22) Cash flows used for investing activities (37,080) (16,871) 40,000 1,233 2,872 (2,714) (12,560) (19,774) (10,089) (100,000) 1,238 1,190 (127,435) CASH FLOWS FROM FINANCING ACTIVITIES Repayment of long-term debt Interest paid Proceeds from share issuances (note 15) Cash flows from financing activities 4,904 4,904 (53) (28) 4,966 4,885 Effect of foreign currency exchange rate changes on cash and cash equivalents (904) 887 Net increase (decrease) in cash and cash equivalents during the period Cash and cash equivalents, beginning of period Cash and cash equivalents, end of period 19,818 130,438 150,256 (86,050) 216,488 130,438 See accompanying notesStep by Step Solution
There are 3 Steps involved in it
Step: 1

Get Instant Access to Expert-Tailored Solutions
See step-by-step solutions with expert insights and AI powered tools for academic success
Step: 2

Step: 3
Ace Your Homework with AI
Get the answers you need in no time with our AI-driven, step-by-step assistance
Get Started
Trust Me Im Almost An Auditor
Authors: Lily Hazelwood
1st Edition
1791960405, 978-1791960407