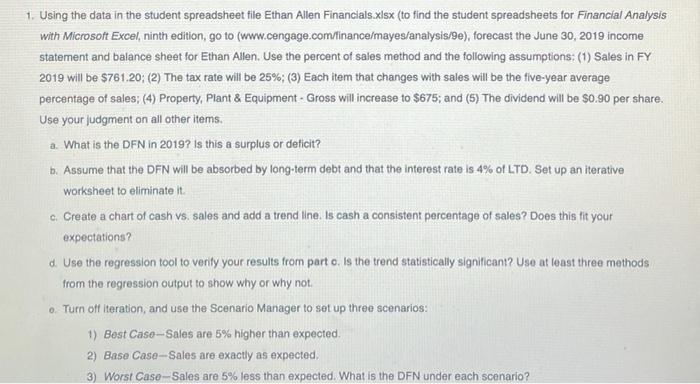
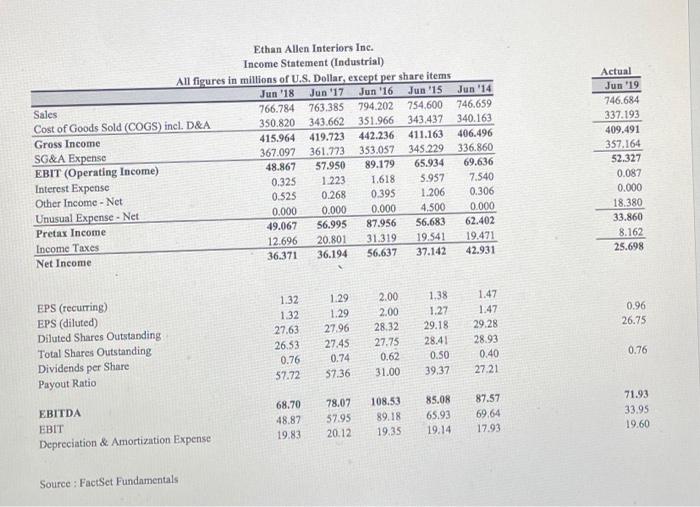
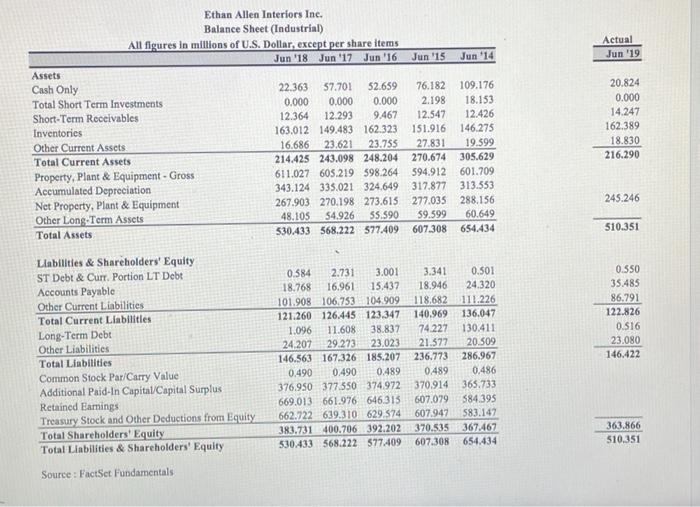
1. Using the data in the student spreadsheet file Ethan Allen Financials.xlsx (to find the student spreadsheets for Financial Analysis with Microsoft Excel, ninth edition, go to (www.cengage.com/finance/mayes/analysis/9e), forecast the June 30, 2019 income statement and balance sheet for Ethan Allen. Use the percent of sales method and the following assumptions: (1) Sales in FY 2019 will be $761.20; (2) The tax rate will be 25%; (3) Each item that changes with sales will be the five-year average percentage of sales; (4) Property, Plant & Equipment - Gross will increase to $675; and (5) The dividend will be $0.90 per share. Use your judgment on all other items. a. What is the DFN in 2019? Is this a surplus or deficit? b. Assume that the DFN will be absorbed by long-term debt and that the interest rate is 4% of LTD. Set up an iterative worksheet to eliminate it. c. Create a chart of cash vs. sales and add a trend line. Is cash a consistent percentage of sales? Does this fit your expectations? d. Use the regression tool to verify your results from parto. Is the trend statistically significant? Use at least three methods from the regression output to show why or why not o Turn off iteration, and use the Scenario Manager to set up three scenarios: 1) Best Case-Sales are 5% higher than expected. 2) Base Case-Sales are exactly as expected, 3) Worst Case-Sales are 5% less than expected. What is the DFN under each scenario? Ethan Allen Interiors Inc. Income Statement Industrial) All figures in millions of U.S. Dollar, except per share items Jun '18 Jun '17 Jun '16 Jun '15 Jun '14 Sales 766.784 763.385 794,202 754,600 746.659 Cost of Goods Sold (COGS) incl. D&A 350.820 343,662 351.966 343.437 340.163 Gross Income 415.964 419.723 442.236 411.163 406.496 SG&A Expense 367.097 361.773 353.057 345.229 336.860 EBIT (Operating Income) 48.867 57.950 89.179 65.934 69.636 Interest Expense 0.325 1.223 1.618 5.957 7.540 Other Income - Net 0.525 0.268 0.395 1.206 0.306 Unusual Expense - Net 0.000 0.000 0.000 4.500 0.000 Pretax Income 49.067 56.995 87.956 56.683 62.402 12.696 Income Taxes 20.801 19.541 31.319 19.471 Net Income 36.371 36.194 56.637 37.142 42.931 Actual Jun '19 746.684 337.193 409.491 357.164 52.327 0.087 0.000 18.380 33.860 8.162 25.698 0.96 26.75 EPS (recurring) EPS (diluted) Diluted Shares Outstanding Total Shares Outstanding Dividends per Share Payout Ratio 1.32 1.32 27.63 26.53 0.76 57.72 1.29 1.29 27.96 27.45 0.74 57.36 2.00 2.00 28.32 27.75 0.62 31.00 1.38 1.27 29.18 28.41 0.50 39.37 1.47 1.47 29.28 28.93 0.40 27.21 0.76 68.70 48.87 19.83 EBITDA EBIT Depreciation & Amortization Expense 78.07 57.95 20.12 108.53 89.18 19.35 85.08 65.93 19.14 71.93 33.95 19.60 87.57 69.64 17.93 Source : FactSet Fundamentals Actual Jun '19 Jun '15 Jun 14 0.000 Ethan Allen Interiors Inc. Balance Sheet (Industrial) All figures in millions of U.S. Dollar, except per share items Jun '18 Jun '17 Jun '16 Assets Cash Only 22.363 57.701 52.659 Total Short Term Investments 0.000 0.000 Short-Term Receivables 12.364 12.293 9.467 Inventories 163.012 149.483 162.323 Other Current Assets 16.686 23.621 23.755 Total Current Assets 214.425 243.098 248.204 Property, Plant & Equipment - Gross 611.027 605.219 598.264 Accumulated Depreciation 343.124 335.021 324,649 Net Property, Plant & Equipment 267.903 270.198 273.615 Other Long-Term Assets 48.105 54.926 55.590 Total Assets 530.433 568.222 577.409 76.182 109.176 2.198 18.153 12.547 12.426 151.916 146.275 27.831 19.599 270.674 305.629 594.912 601.709 317.877 313.333 277.035 288.156 59.599 60.649 607 308 654.434 20.824 0.000 14.247 162.389 18.830 216.290 245.246 510.351 Llabilities & Shareholders' Equity ST Debt & Curr. Portion LT Debt Accounts Payable Other Current Liabilities Total Current Liabilities Long-Term Debt Other Liabilities Total Liabilities Common Stock Par/Carry Value Additional Paid-In Capital/Capital Surplus Retained Earnings Treasury Stock and Other Deductions from Equity Total Shareholders' Equity Total Liabilities & Shareholders' Equity 0.584 2.731 3.001 3.341 0.501 18.768 16.961 15,437 18.946 24.320 101.908 106.753 104.909 118.682 111.226 121.260 126.445 123.347 140.969 136.047 1.096 11.608 38.837 74.227 130.411 24.207 29.273 23.023 21.577 20.509 146.563 167.326 185.207236.773 286.967 0.490 0.490 0.489 0.489 0.486 376.950 377.550 374 972 370.914 363.733 669.013 661.976 646.315 607.079 584.395 662.722 639.310 629,574 607.947 583.147 383.731 400.706 392.202 370.535 367.467 530.433 568.222 577.409 607.308 654,434 0.550 35.485 86.791 122.826 0.816 23.080 146.422 363.866 510.351 Source: FactSet Fundamentals 1. Using the data in the student spreadsheet file Ethan Allen Financials.xlsx (to find the student spreadsheets for Financial Analysis with Microsoft Excel, ninth edition, go to (www.cengage.com/finance/mayes/analysis/9e), forecast the June 30, 2019 income statement and balance sheet for Ethan Allen. Use the percent of sales method and the following assumptions: (1) Sales in FY 2019 will be $761.20; (2) The tax rate will be 25%; (3) Each item that changes with sales will be the five-year average percentage of sales; (4) Property, Plant & Equipment - Gross will increase to $675; and (5) The dividend will be $0.90 per share. Use your judgment on all other items. a. What is the DFN in 2019? Is this a surplus or deficit? b. Assume that the DFN will be absorbed by long-term debt and that the interest rate is 4% of LTD. Set up an iterative worksheet to eliminate it. c. Create a chart of cash vs. sales and add a trend line. Is cash a consistent percentage of sales? Does this fit your expectations? d. Use the regression tool to verify your results from parto. Is the trend statistically significant? Use at least three methods from the regression output to show why or why not o Turn off iteration, and use the Scenario Manager to set up three scenarios: 1) Best Case-Sales are 5% higher than expected. 2) Base Case-Sales are exactly as expected, 3) Worst Case-Sales are 5% less than expected. What is the DFN under each scenario? Ethan Allen Interiors Inc. Income Statement Industrial) All figures in millions of U.S. Dollar, except per share items Jun '18 Jun '17 Jun '16 Jun '15 Jun '14 Sales 766.784 763.385 794,202 754,600 746.659 Cost of Goods Sold (COGS) incl. D&A 350.820 343,662 351.966 343.437 340.163 Gross Income 415.964 419.723 442.236 411.163 406.496 SG&A Expense 367.097 361.773 353.057 345.229 336.860 EBIT (Operating Income) 48.867 57.950 89.179 65.934 69.636 Interest Expense 0.325 1.223 1.618 5.957 7.540 Other Income - Net 0.525 0.268 0.395 1.206 0.306 Unusual Expense - Net 0.000 0.000 0.000 4.500 0.000 Pretax Income 49.067 56.995 87.956 56.683 62.402 12.696 Income Taxes 20.801 19.541 31.319 19.471 Net Income 36.371 36.194 56.637 37.142 42.931 Actual Jun '19 746.684 337.193 409.491 357.164 52.327 0.087 0.000 18.380 33.860 8.162 25.698 0.96 26.75 EPS (recurring) EPS (diluted) Diluted Shares Outstanding Total Shares Outstanding Dividends per Share Payout Ratio 1.32 1.32 27.63 26.53 0.76 57.72 1.29 1.29 27.96 27.45 0.74 57.36 2.00 2.00 28.32 27.75 0.62 31.00 1.38 1.27 29.18 28.41 0.50 39.37 1.47 1.47 29.28 28.93 0.40 27.21 0.76 68.70 48.87 19.83 EBITDA EBIT Depreciation & Amortization Expense 78.07 57.95 20.12 108.53 89.18 19.35 85.08 65.93 19.14 71.93 33.95 19.60 87.57 69.64 17.93 Source : FactSet Fundamentals Actual Jun '19 Jun '15 Jun 14 0.000 Ethan Allen Interiors Inc. Balance Sheet (Industrial) All figures in millions of U.S. Dollar, except per share items Jun '18 Jun '17 Jun '16 Assets Cash Only 22.363 57.701 52.659 Total Short Term Investments 0.000 0.000 Short-Term Receivables 12.364 12.293 9.467 Inventories 163.012 149.483 162.323 Other Current Assets 16.686 23.621 23.755 Total Current Assets 214.425 243.098 248.204 Property, Plant & Equipment - Gross 611.027 605.219 598.264 Accumulated Depreciation 343.124 335.021 324,649 Net Property, Plant & Equipment 267.903 270.198 273.615 Other Long-Term Assets 48.105 54.926 55.590 Total Assets 530.433 568.222 577.409 76.182 109.176 2.198 18.153 12.547 12.426 151.916 146.275 27.831 19.599 270.674 305.629 594.912 601.709 317.877 313.333 277.035 288.156 59.599 60.649 607 308 654.434 20.824 0.000 14.247 162.389 18.830 216.290 245.246 510.351 Llabilities & Shareholders' Equity ST Debt & Curr. Portion LT Debt Accounts Payable Other Current Liabilities Total Current Liabilities Long-Term Debt Other Liabilities Total Liabilities Common Stock Par/Carry Value Additional Paid-In Capital/Capital Surplus Retained Earnings Treasury Stock and Other Deductions from Equity Total Shareholders' Equity Total Liabilities & Shareholders' Equity 0.584 2.731 3.001 3.341 0.501 18.768 16.961 15,437 18.946 24.320 101.908 106.753 104.909 118.682 111.226 121.260 126.445 123.347 140.969 136.047 1.096 11.608 38.837 74.227 130.411 24.207 29.273 23.023 21.577 20.509 146.563 167.326 185.207236.773 286.967 0.490 0.490 0.489 0.489 0.486 376.950 377.550 374 972 370.914 363.733 669.013 661.976 646.315 607.079 584.395 662.722 639.310 629,574 607.947 583.147 383.731 400.706 392.202 370.535 367.467 530.433 568.222 577.409 607.308 654,434 0.550 35.485 86.791 122.826 0.816 23.080 146.422 363.866 510.351 Source: FactSet Fundamentals