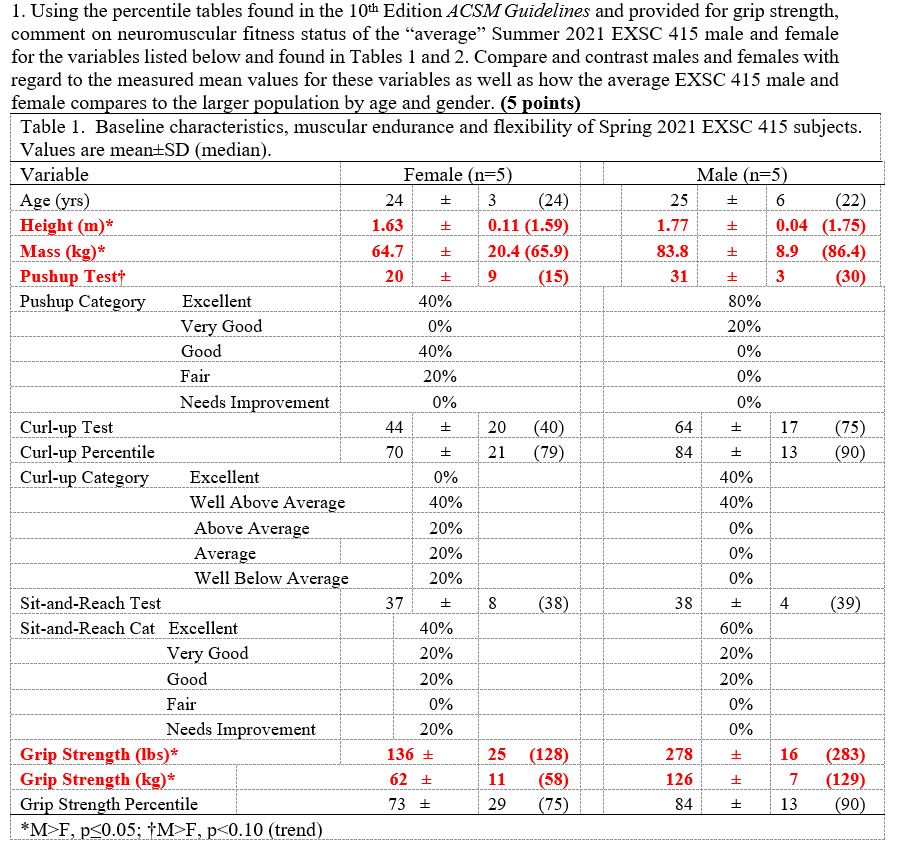
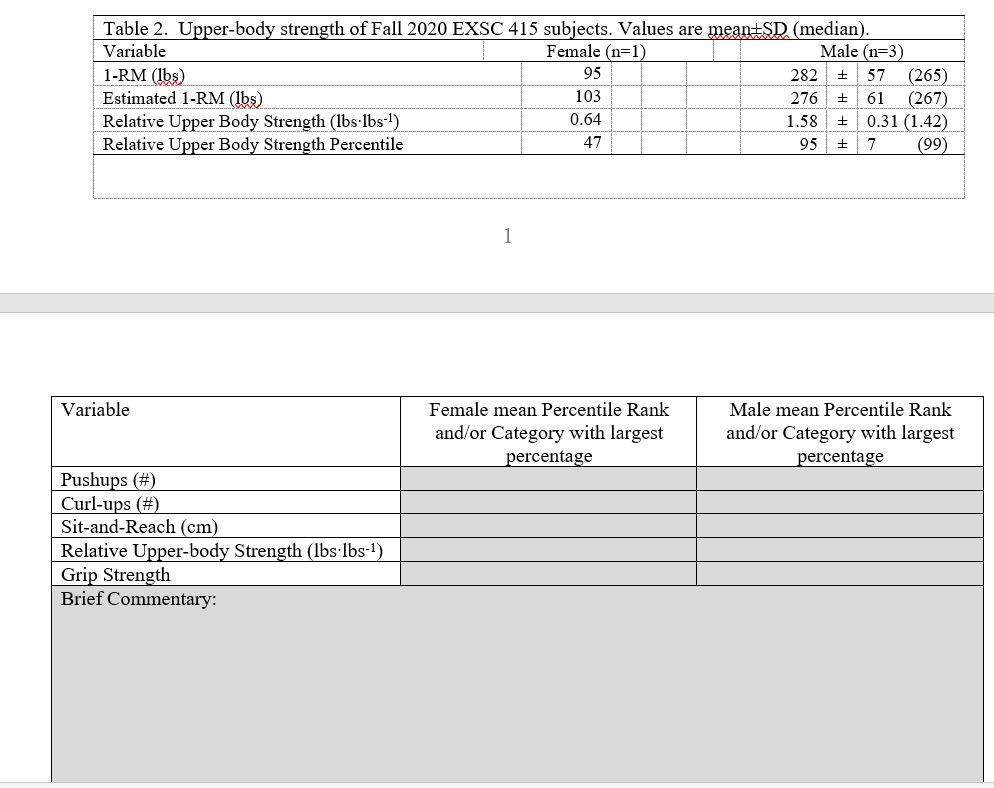
1. Using the percentile tables found in the 10th Edition ACSM Guidelines and provided for grip strength, comment on neuromuscular fitness status of the "average" Summer 2021 EXSC 415 male and female for the variables listed below and found in Tables 1 and 2. Compare and contrast males and females with regard to the measured mean values for these variables as well as how the average EXSC 415 male and female compares to the larger population by age and gender. (5 points) Table 1. Baseline characteristics, muscular endurance and flexibility of Spring 2021 EXSC 415 subjects. Values are meantSD (median) Variable Female (n=5) Male (n=5) Age (yrs) 24 3 (24) 25 F 6 (22) Height (m)* 1.63 0.11 (1.59) 1.77 0.04 (1.75) Mass (kg)* 54.7 F 20.4 (65.9) 83.8 F 8.9 (86.4) Pushup Test+ 20 9 (15) 31 F 3 (30) Pushup Category Excellent 40% 80% Very Good 0% 20% Good 40% 0% Fair 20% 0% Needs Improvement 0% 0% Curl-up Test 44 F 20 (40) 64 F 17 (75) Curl-up Percentile 70 21 (79) 84 F 13 90) Curl-up Category Excellent 40% Well Above Average 40% 40% Above Average 20% 0% Average 20% 0% Well Below Average 20% 0% Sit-and-Reach Test 37 F 8 (38) 38 F 4 (39) Sit-and-Reach Cat Excellent 40% 60% Very Good 20% 20% Good 20% 20% Fair 0% Needs Improvement 20% 0% Grip Strength (Ibs)* 136 + 25 (128) 278 F 16 (283) Grip Strength (kg)* 62 + 11 (58) 126 F 7 (129) Grip Strength Percentile 73 + 29 (75) 84 F 13 (90) *M F, p 0.05; IM F, p 0.10 (trend)Table 2. Upper-body strength of Fall 2020 EXSC 415 subjects. Values are meantSD (median). Variable Female (n=1) Male (n=3) 1-RM (1bs) 282 57 (265) Estimated 1-RM (1bs) 103 276 + 61 (267) Relative Upper Body Strength (Ibs.lbs-1) 0.64 1.58 + 0.31 (1.42) Relative Upper Body Strength Percentile 47 95 + 7 (99) Variable Female mean Percentile Rank Male mean Percentile Rank and/or Category with largest and/or Category with largest percentage percentage Pushups (#) Curl-ups (#) Sit-and-Reach (cm) Relative Upper-body Strength (Ibs.Ibs-1) Grip Strength Brief Commentary