

Answered step by step
Verified Expert Solution
Question
1 Approved Answer
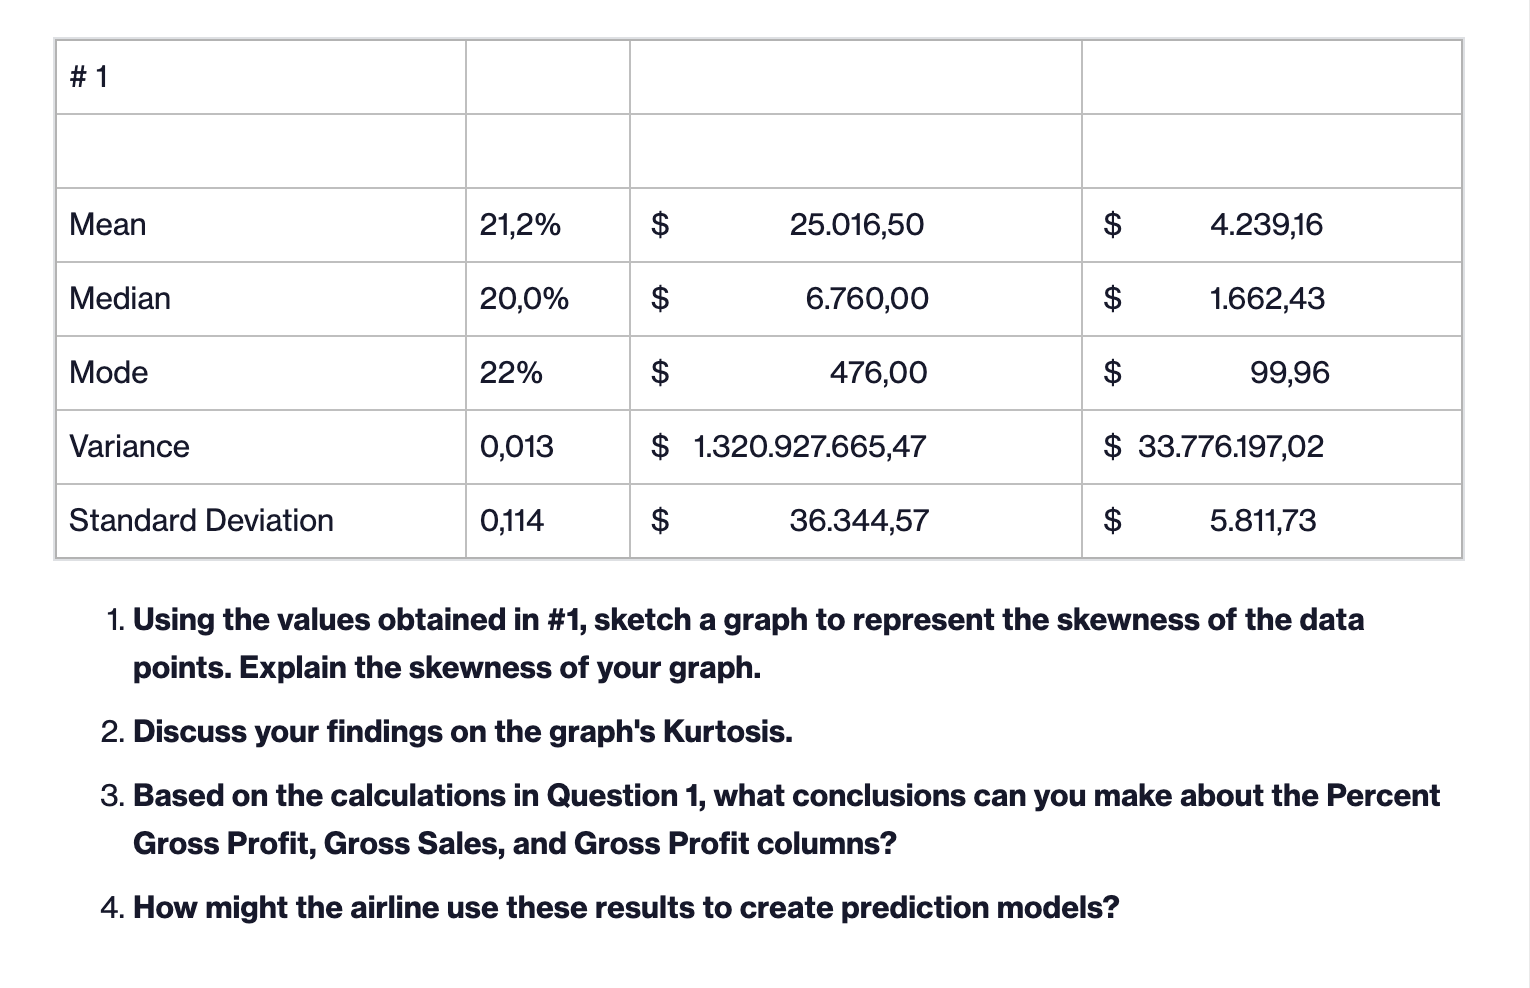
1. Using the values obtained in #1, sketch a graph to represent the skewness of the data points. Explain the skewness of your graph. 2.
Step by Step Solution
There are 3 Steps involved in it
Step: 1

Get Instant Access to Expert-Tailored Solutions
See step-by-step solutions with expert insights and AI powered tools for academic success
Step: 2

Step: 3
Ace Your Homework with AI
Get the answers you need in no time with our AI-driven, step-by-step assistance
Get Started
Finance Directors Handbook
Authors: Glynis D Morris, Sonia McKay, Andrea Oates
5th Edition
1566768691, 978-1566768696