

Question: 1) Waves including light and sound exhibit interference which is an effect of two or more waves being superimposed or added at the same location
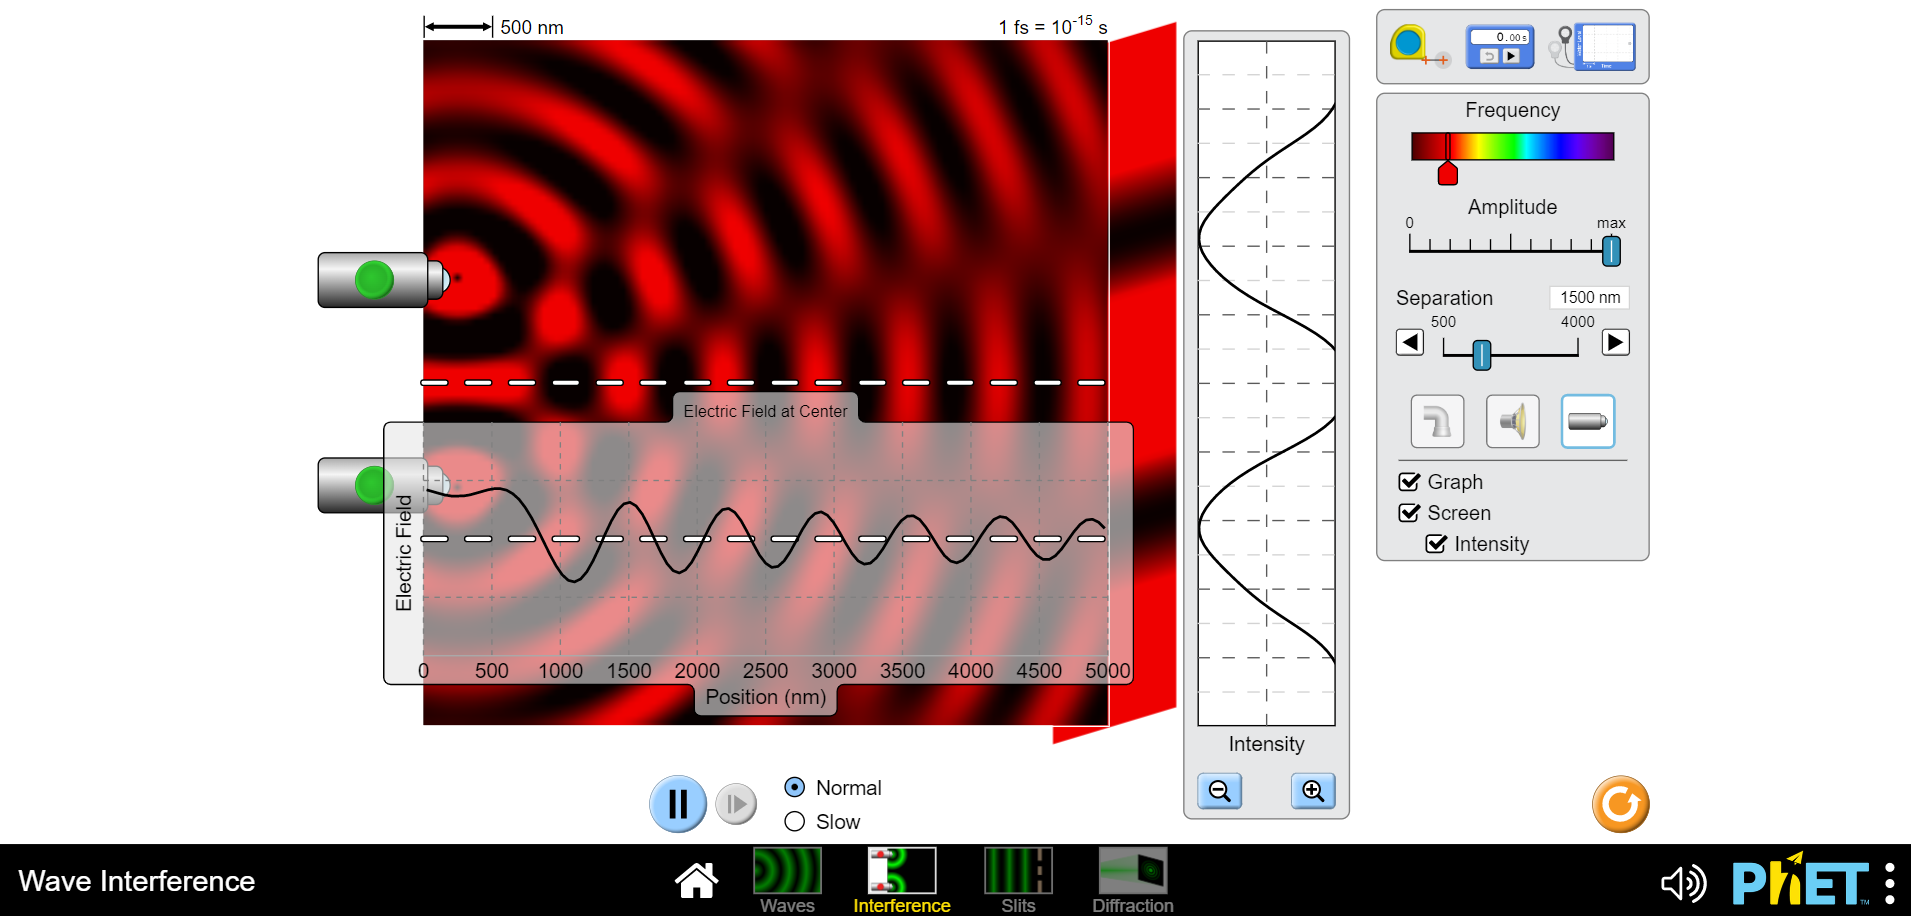
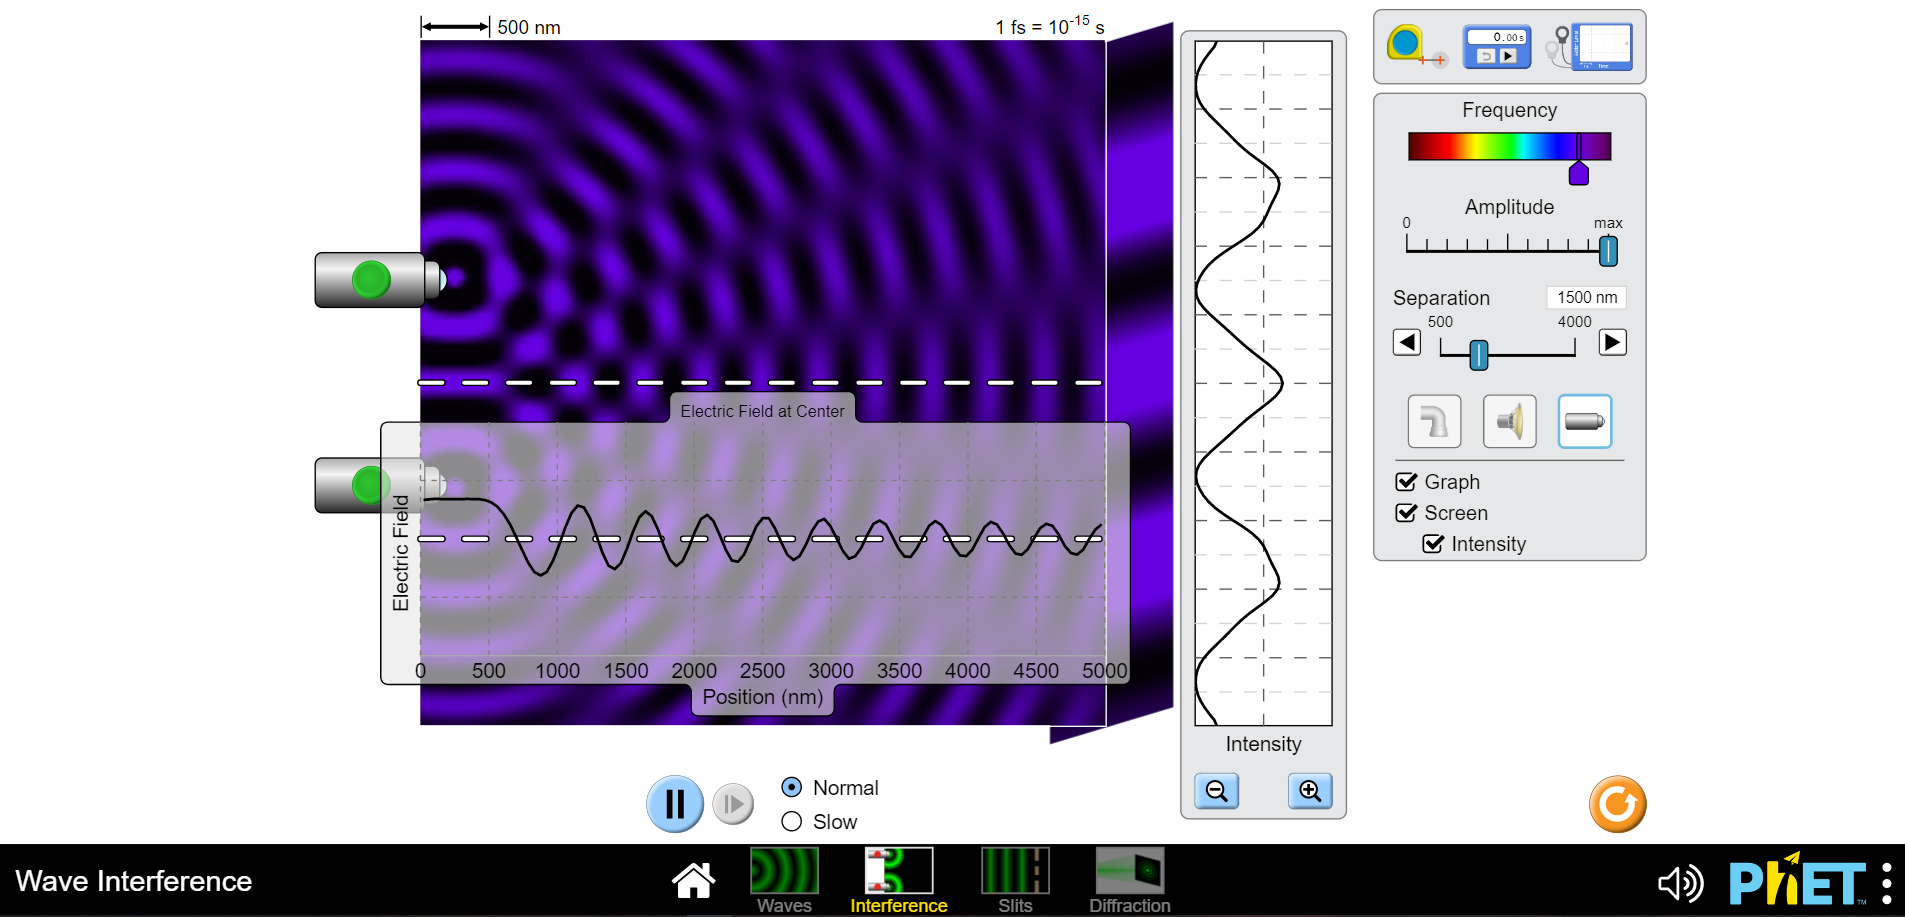
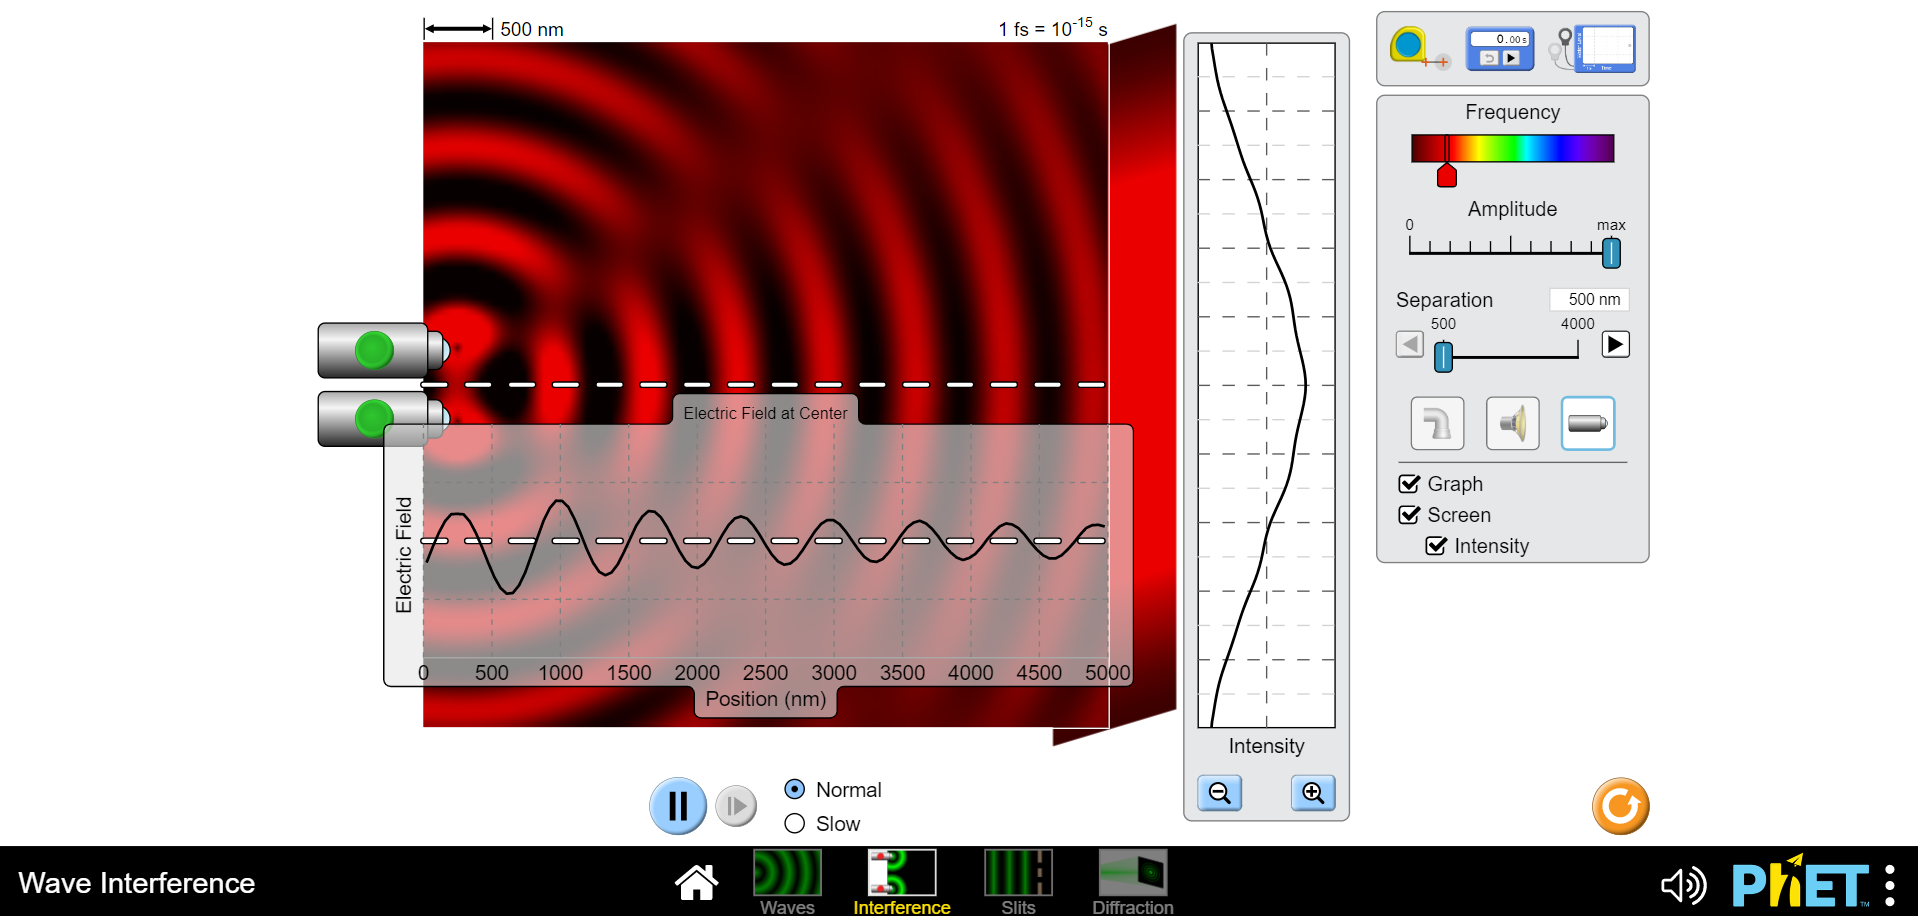
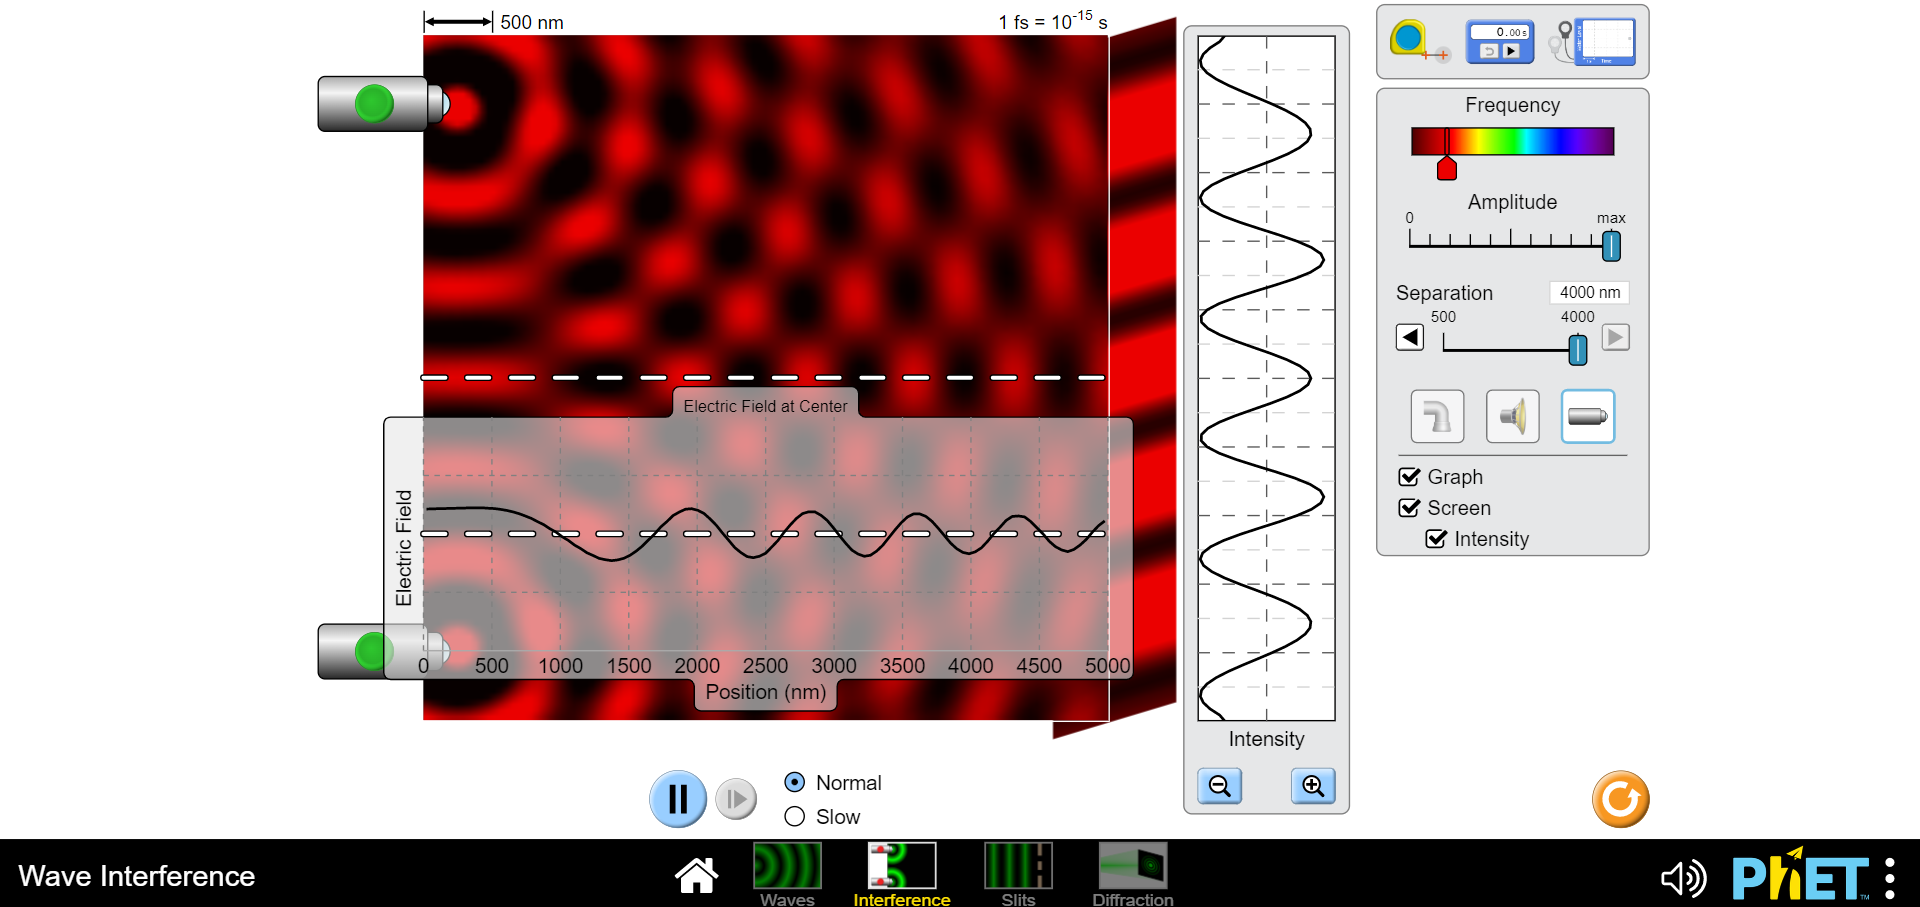
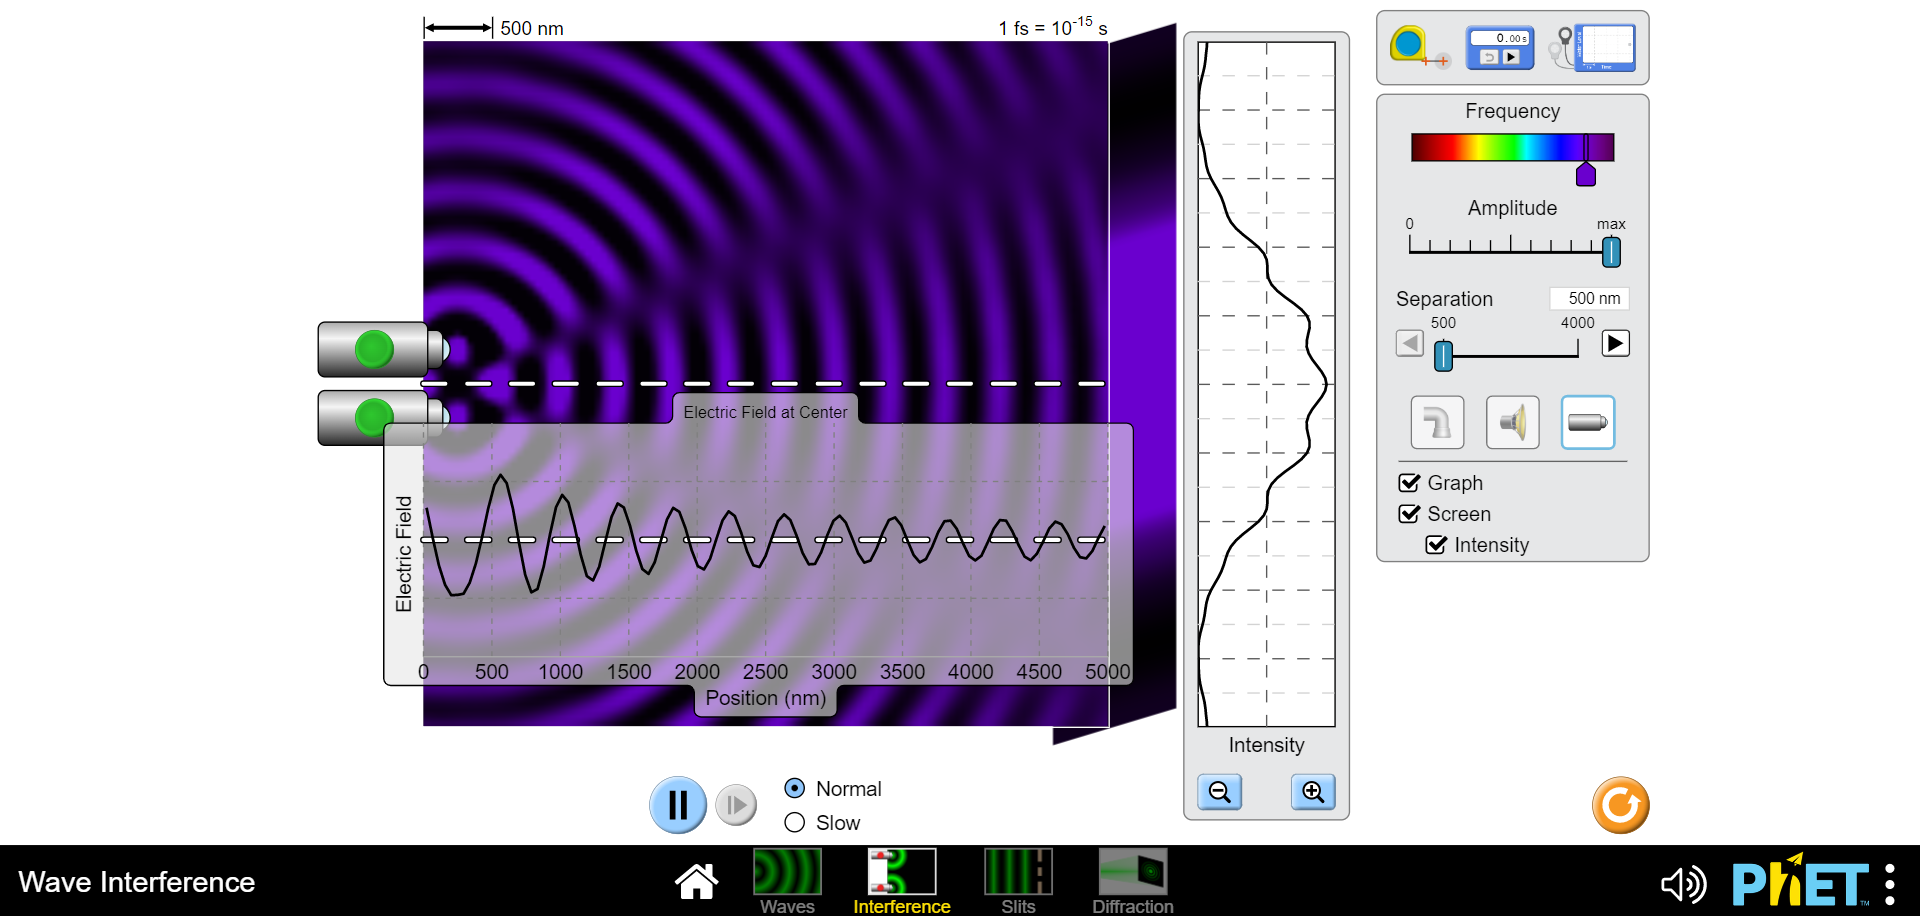
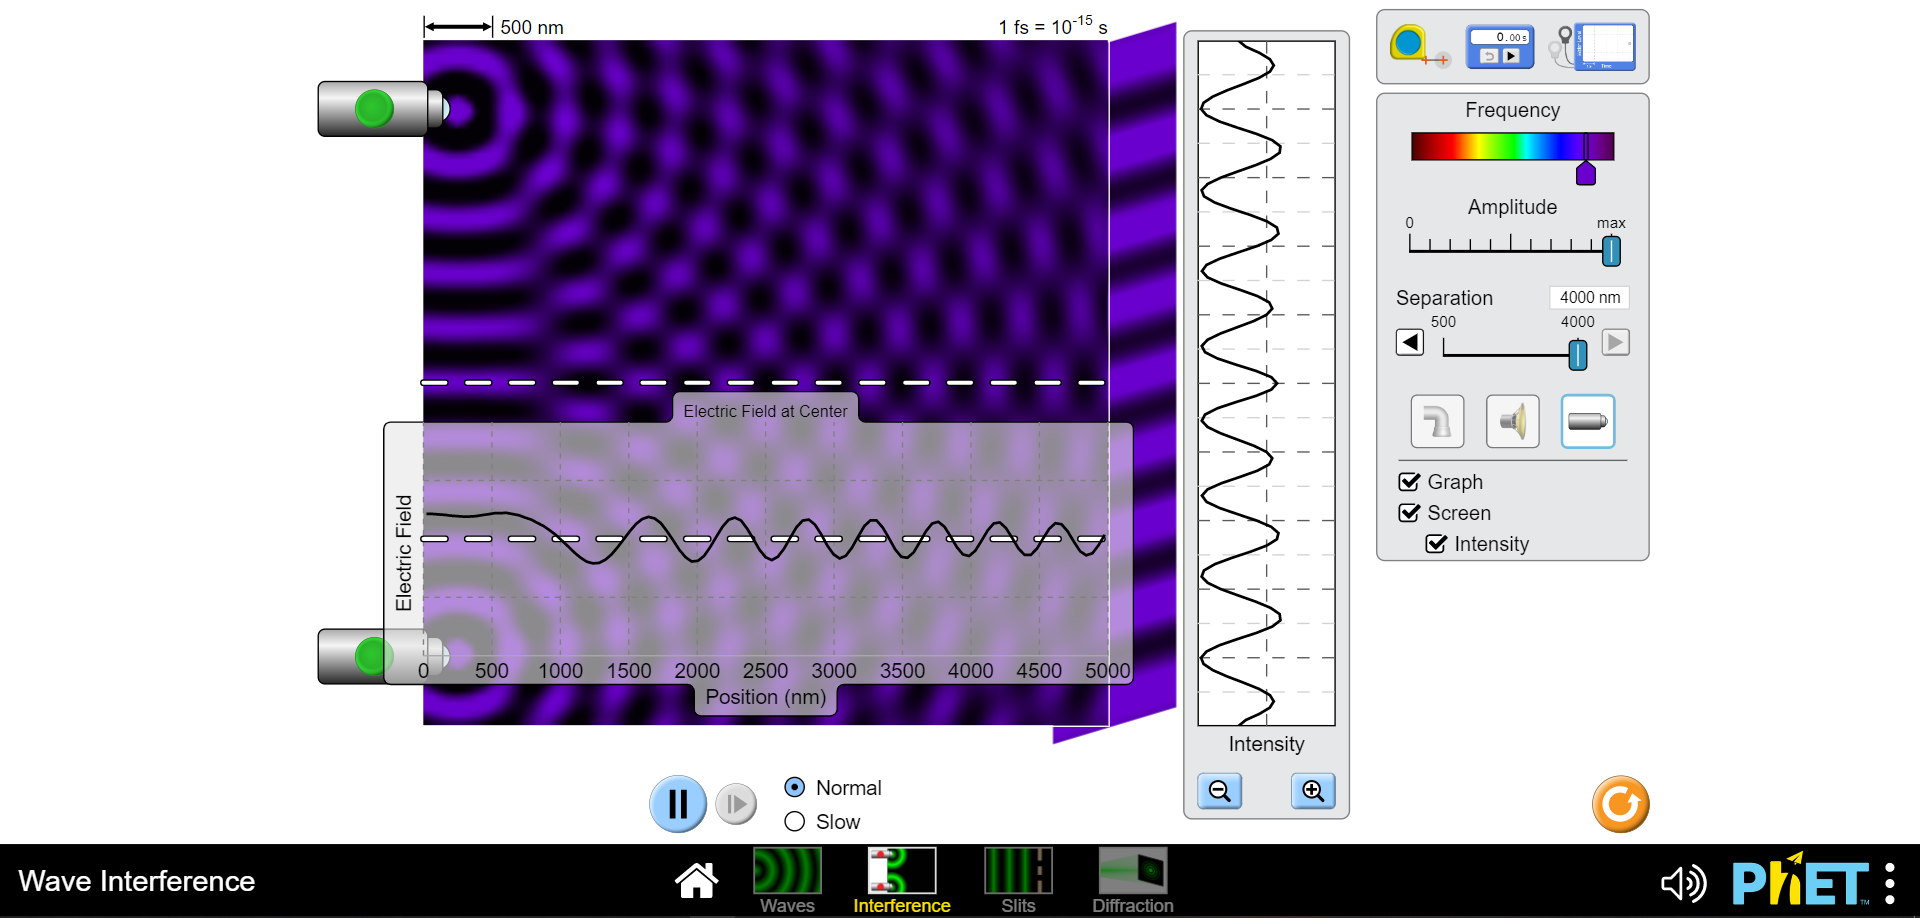
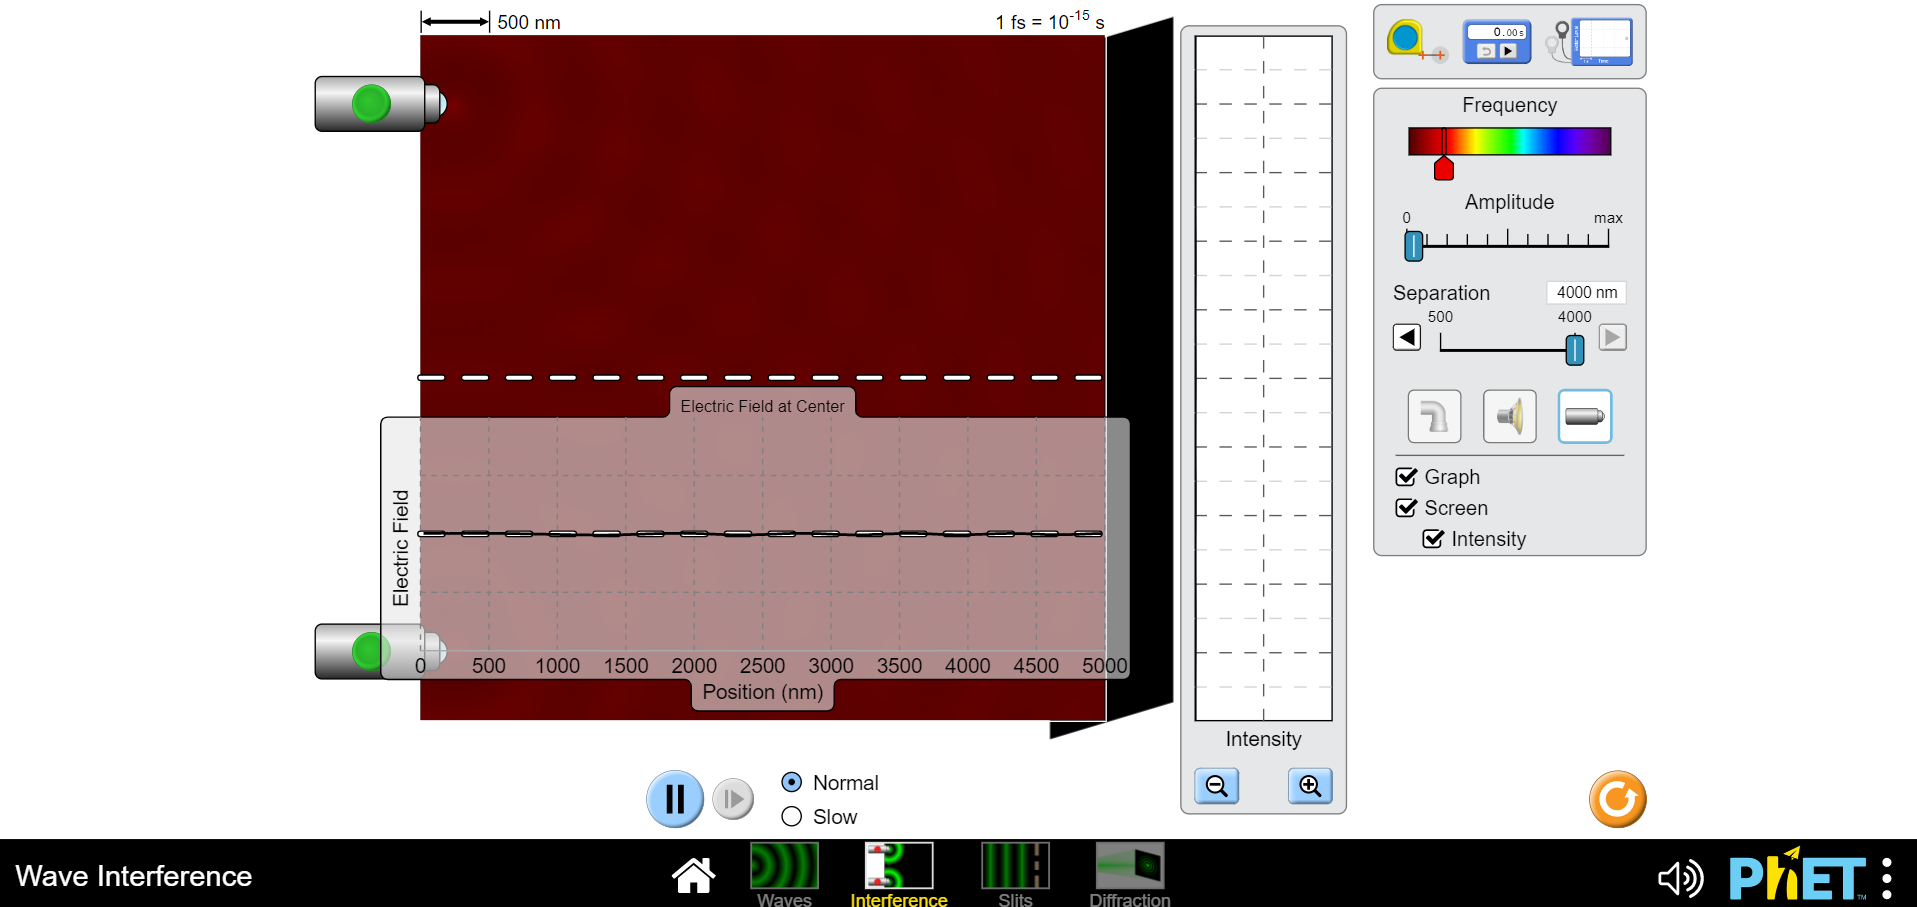
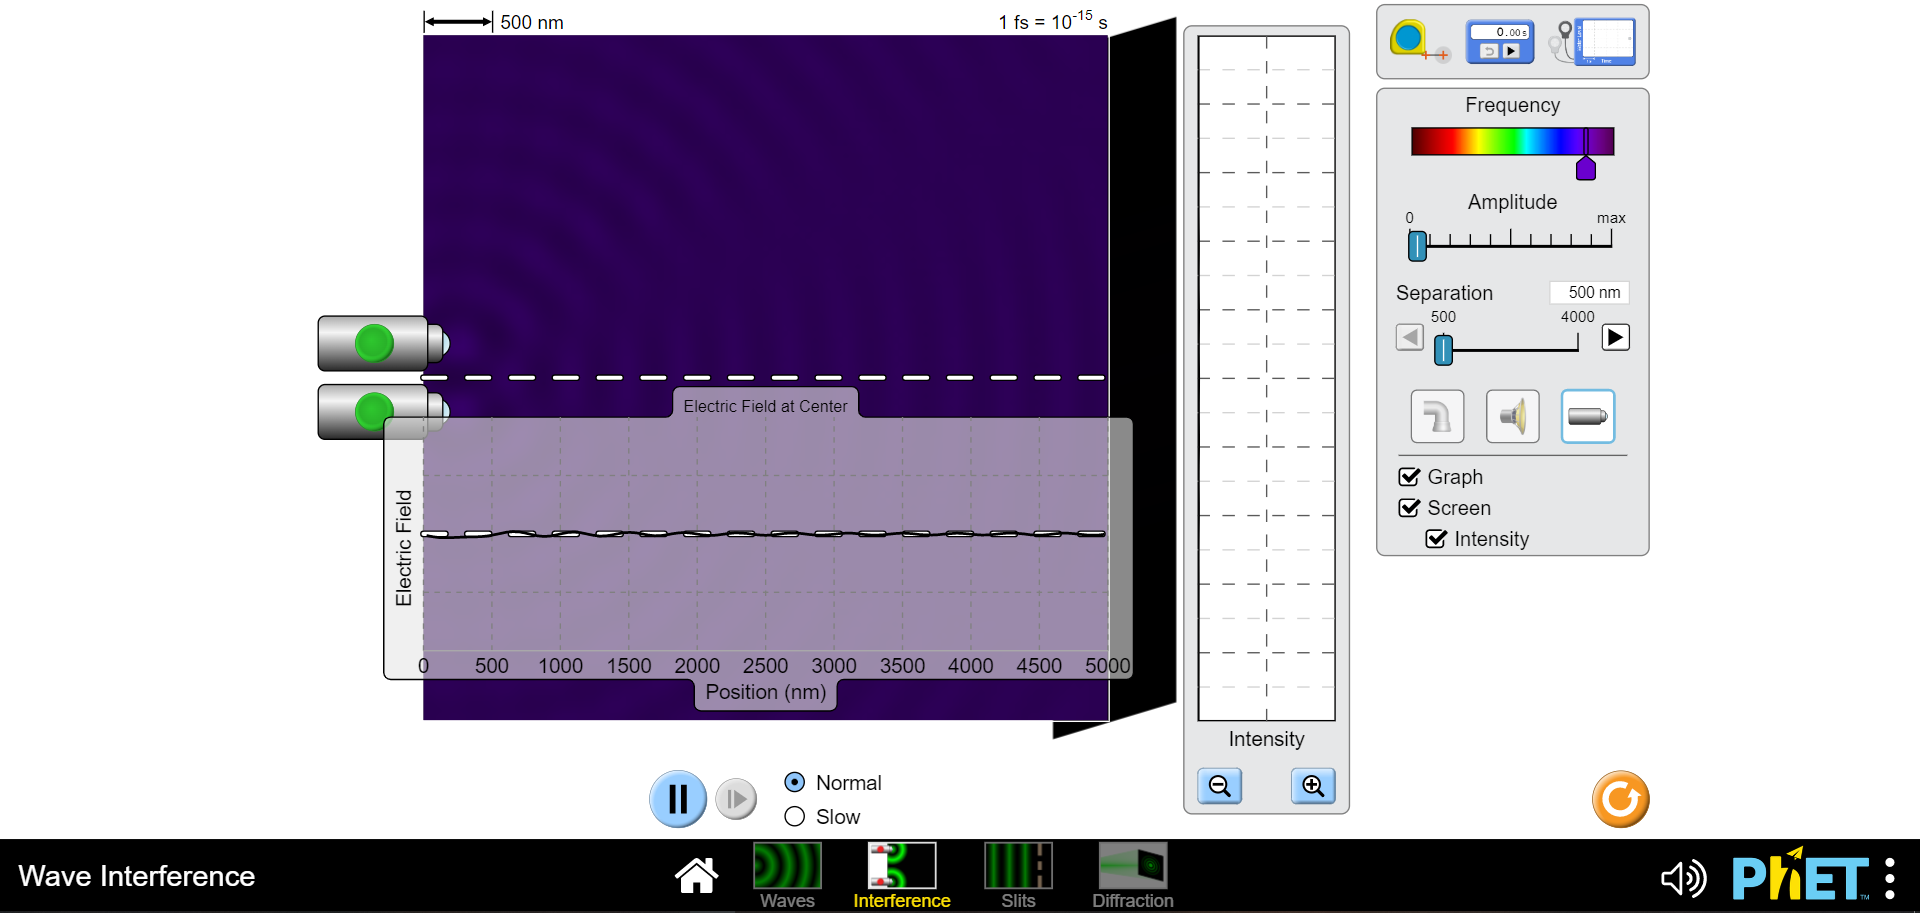
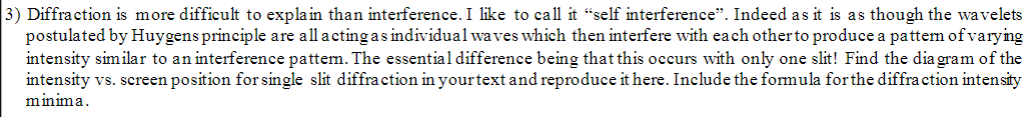
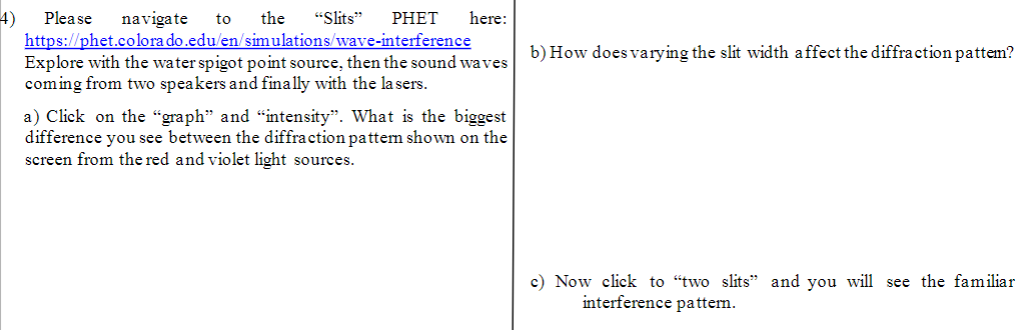

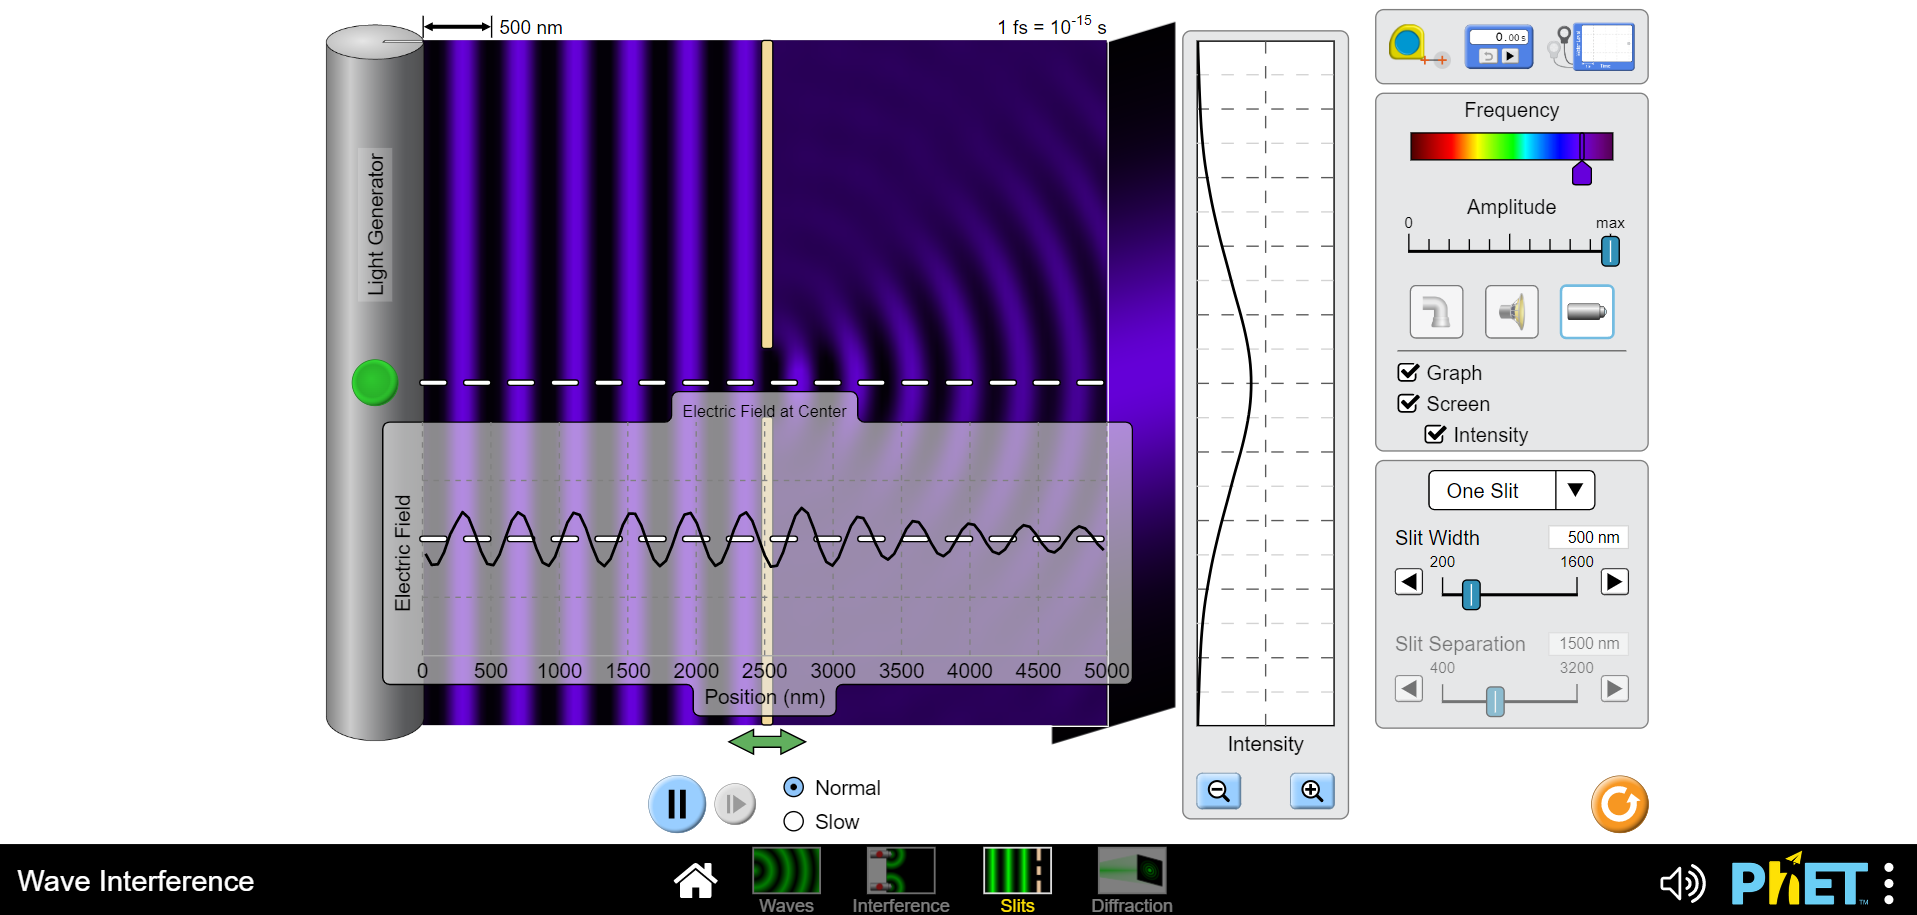
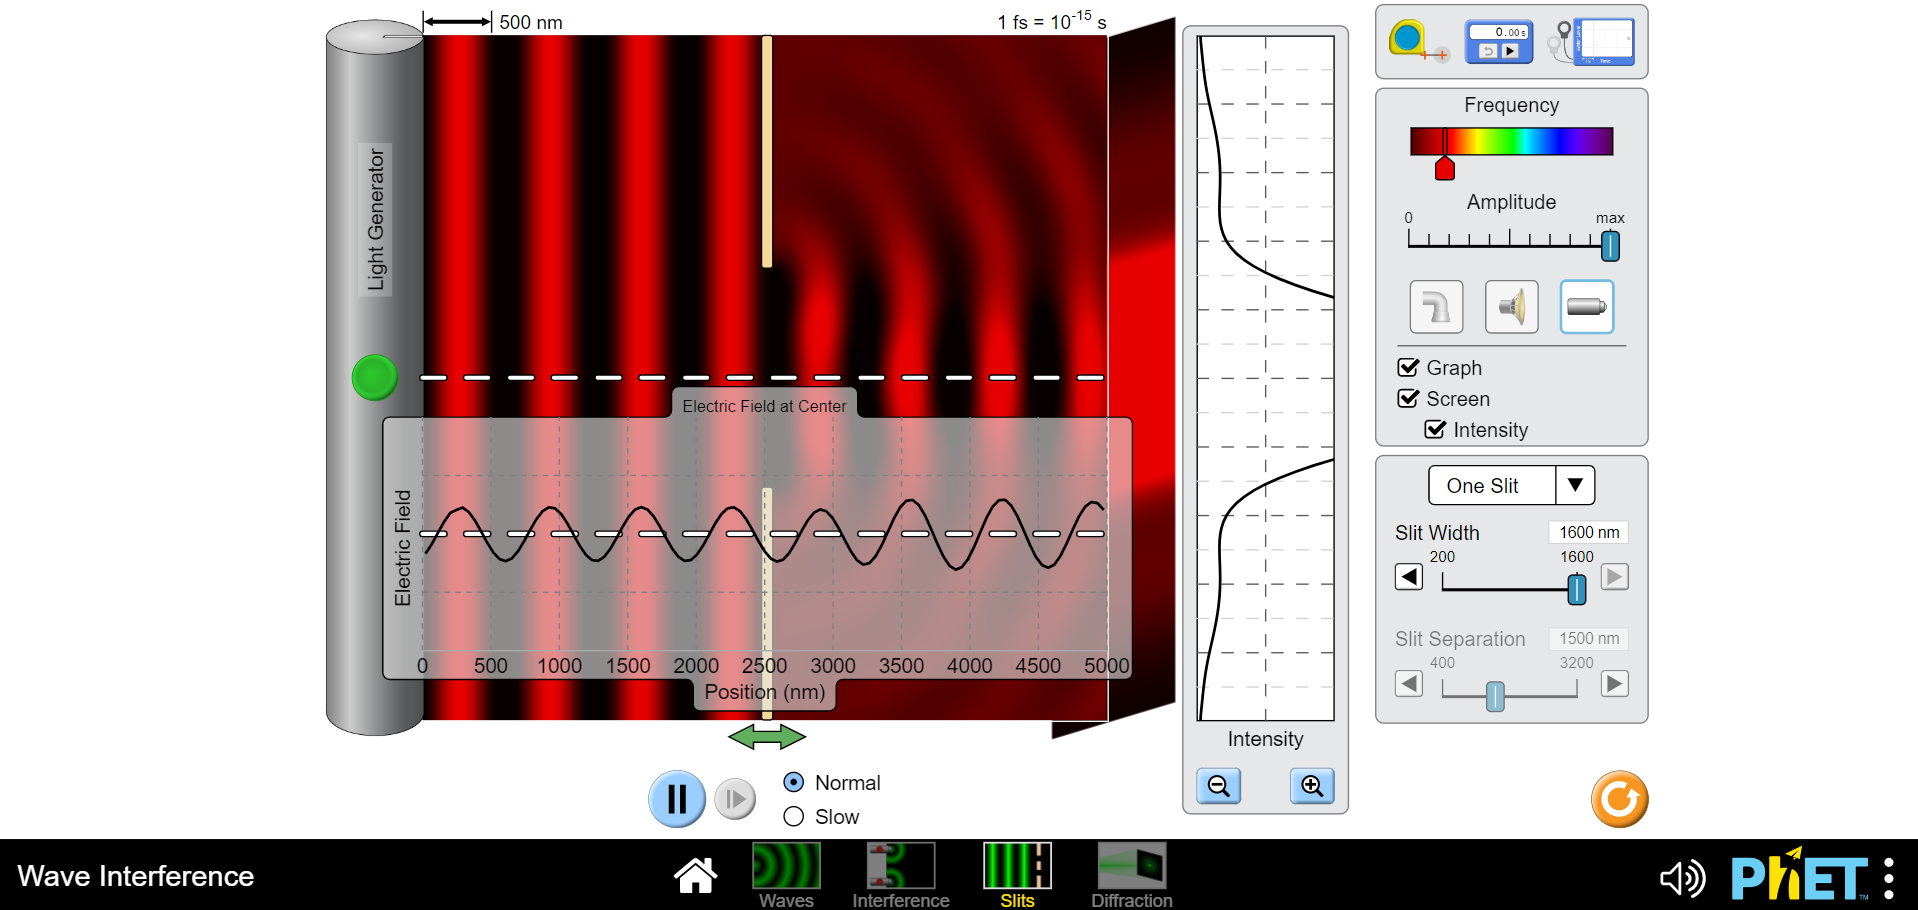
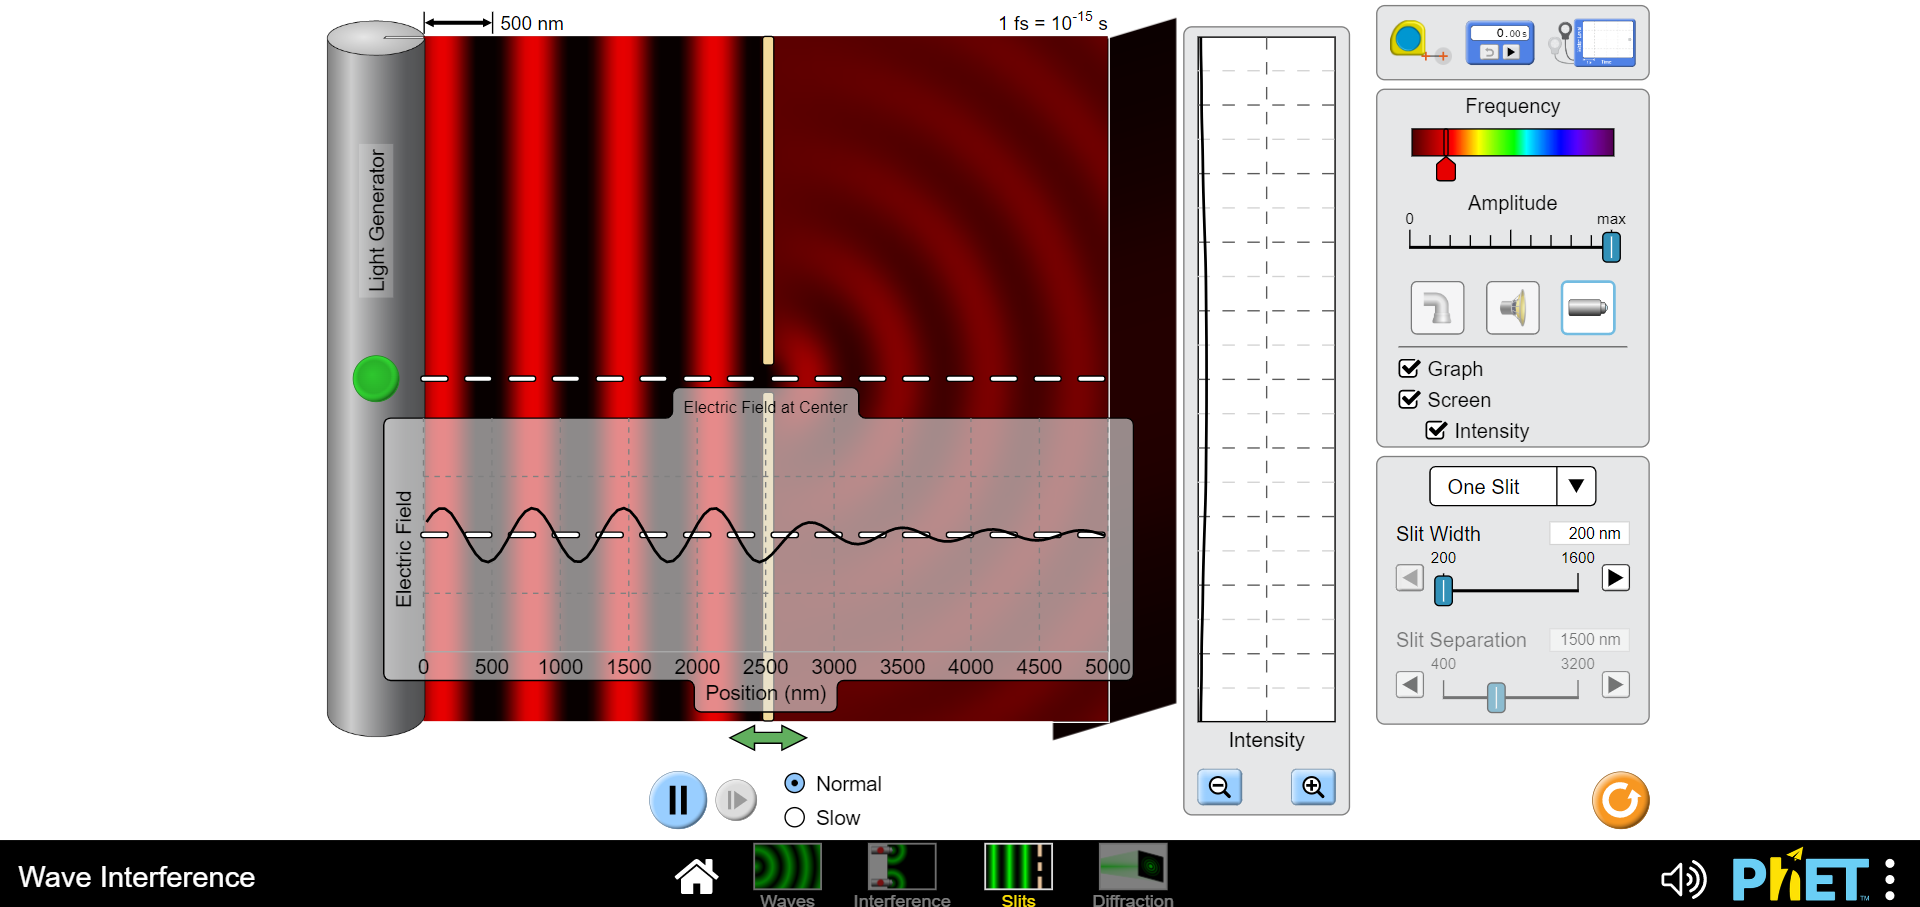
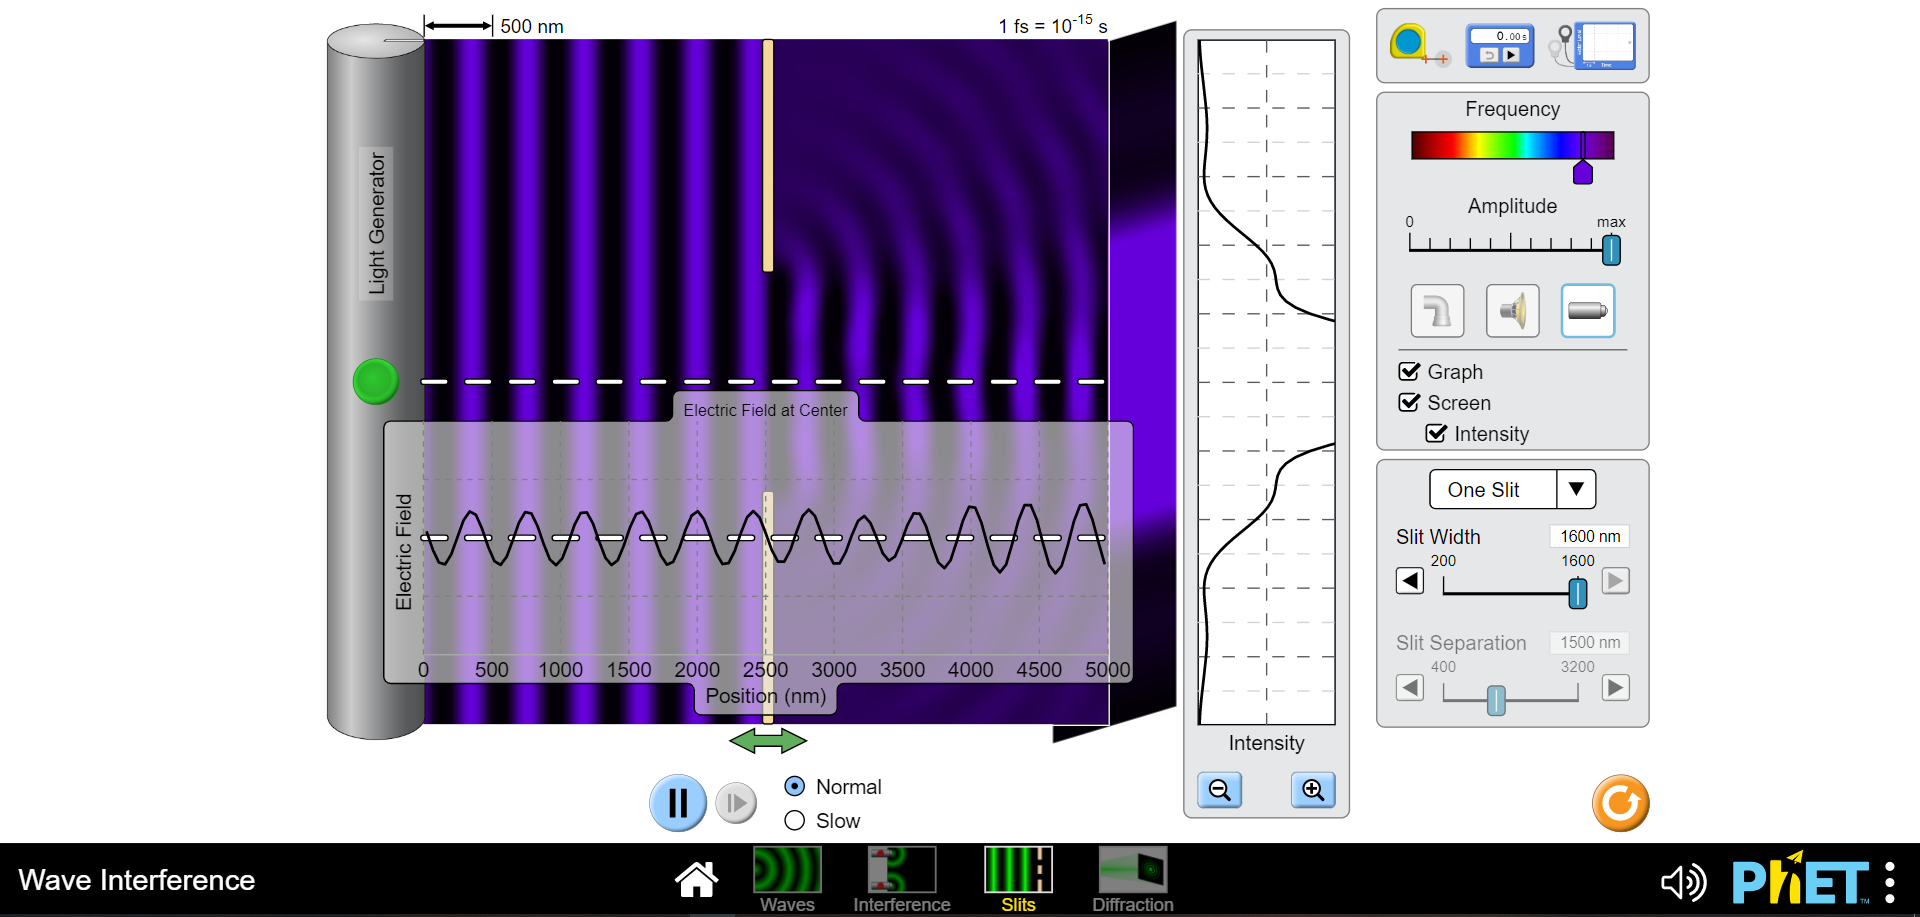
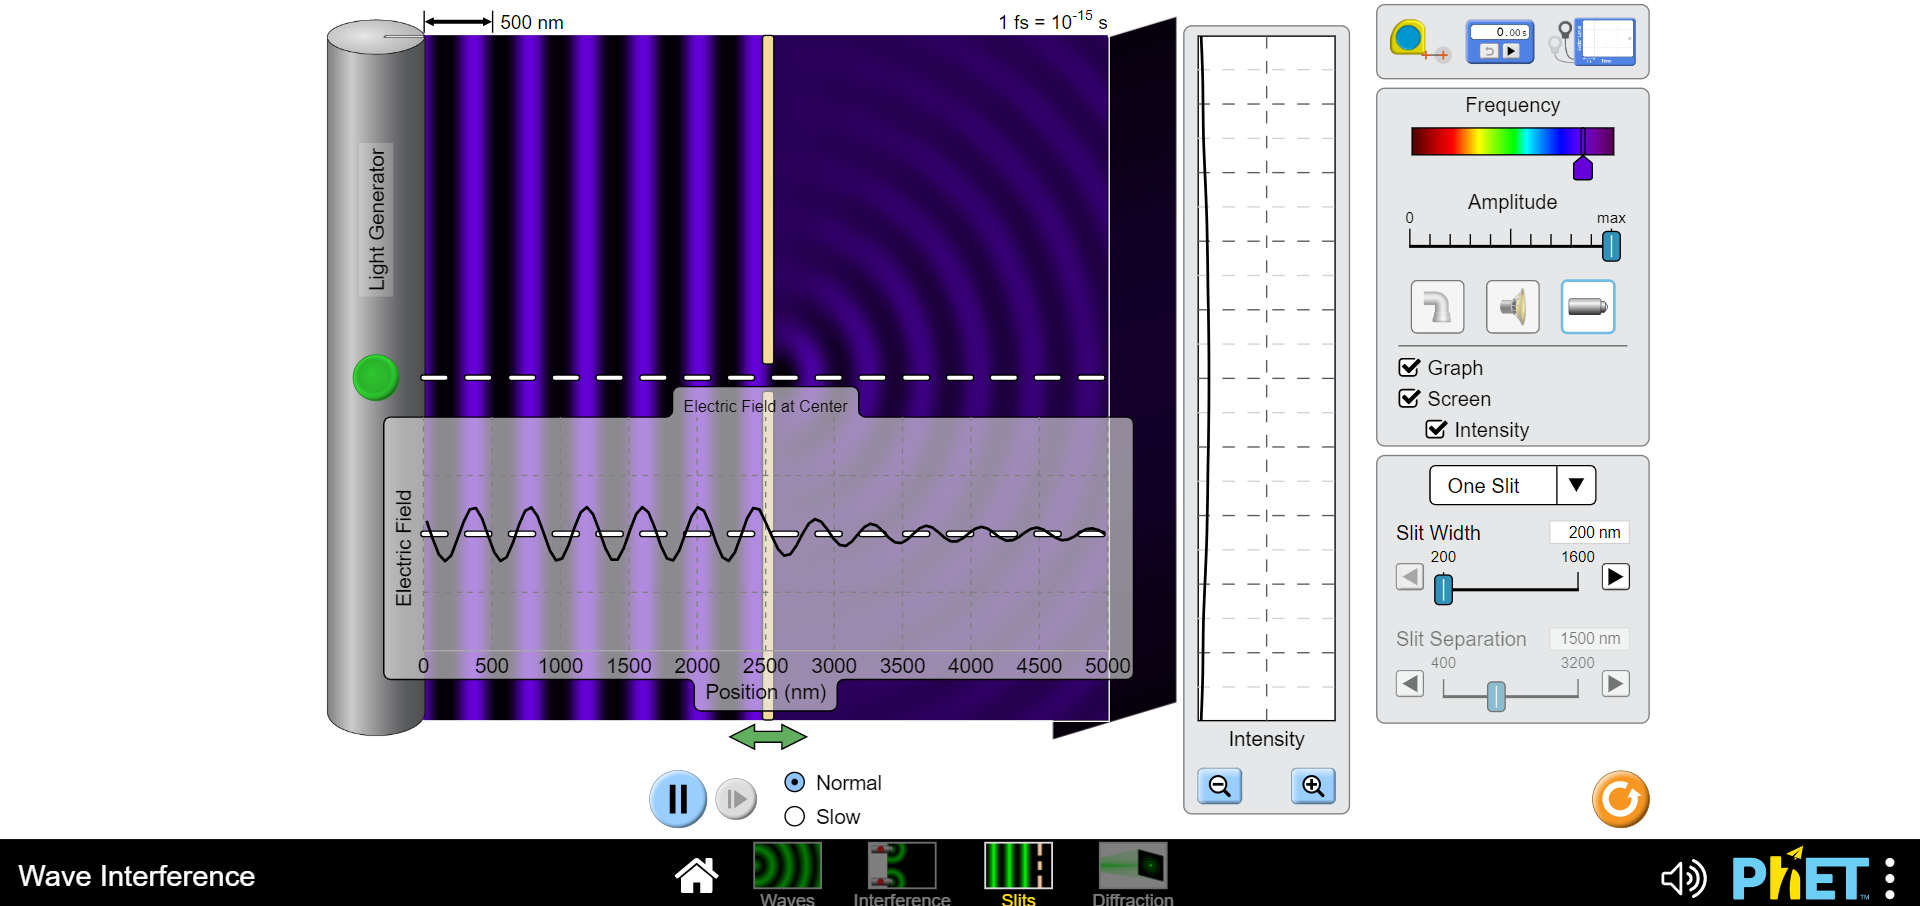
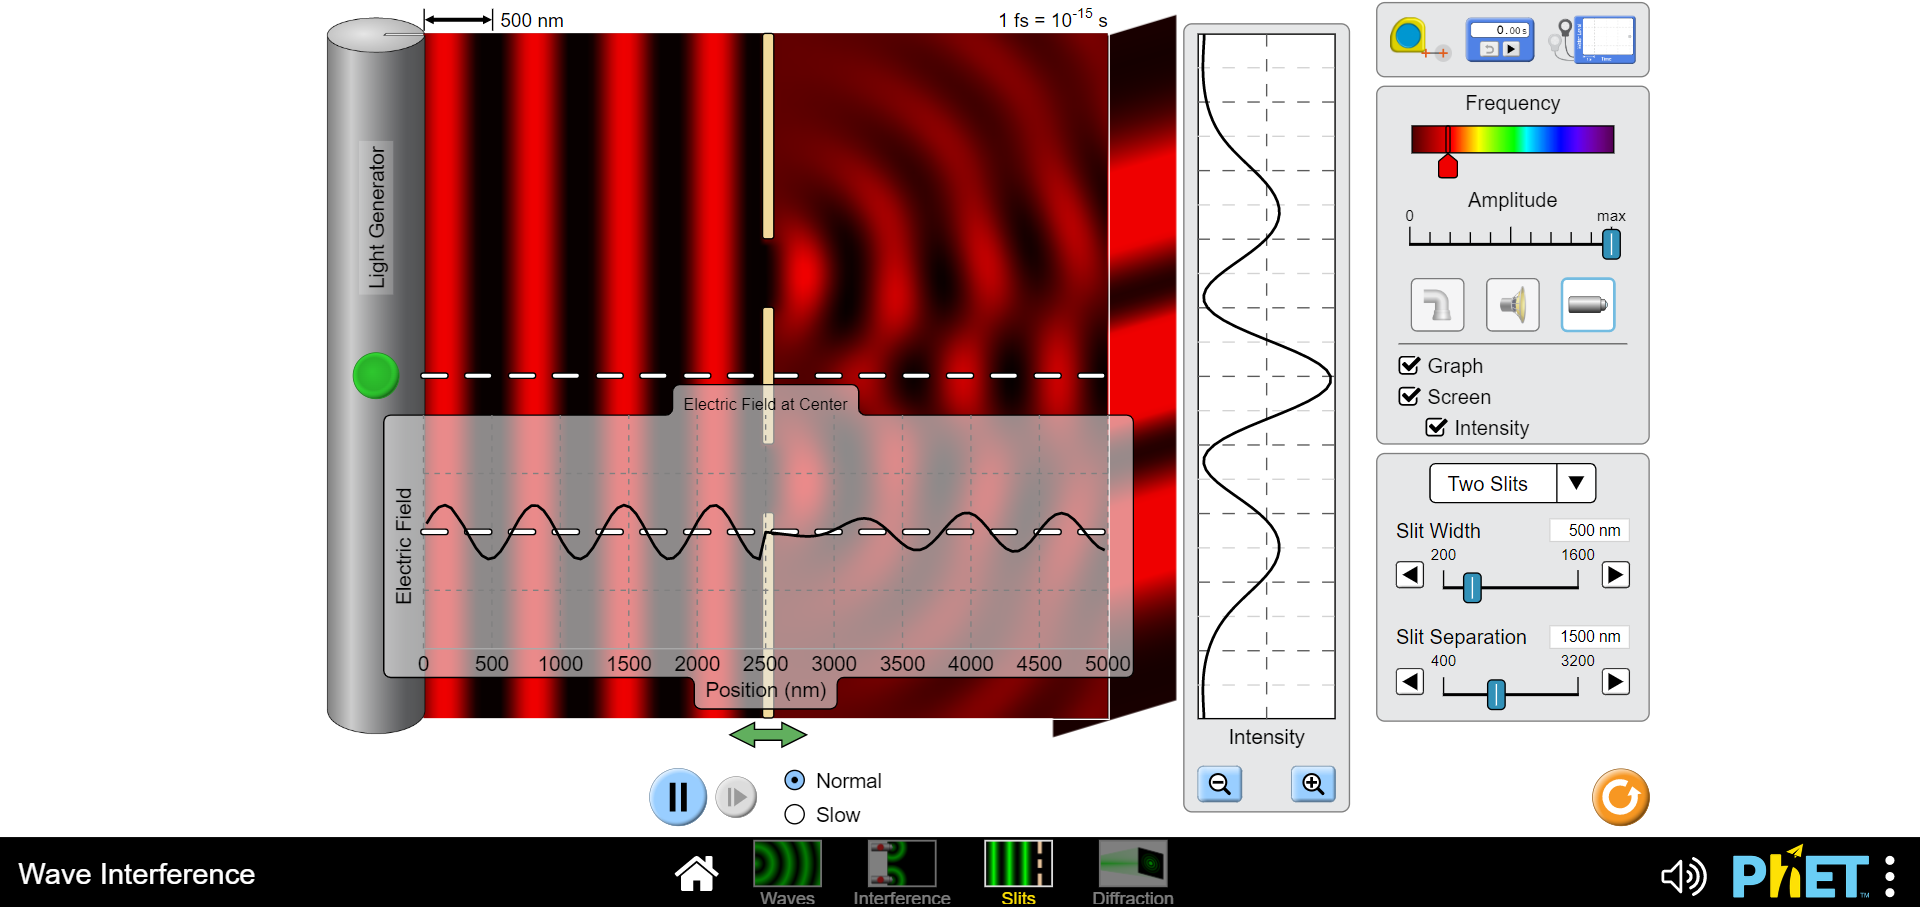
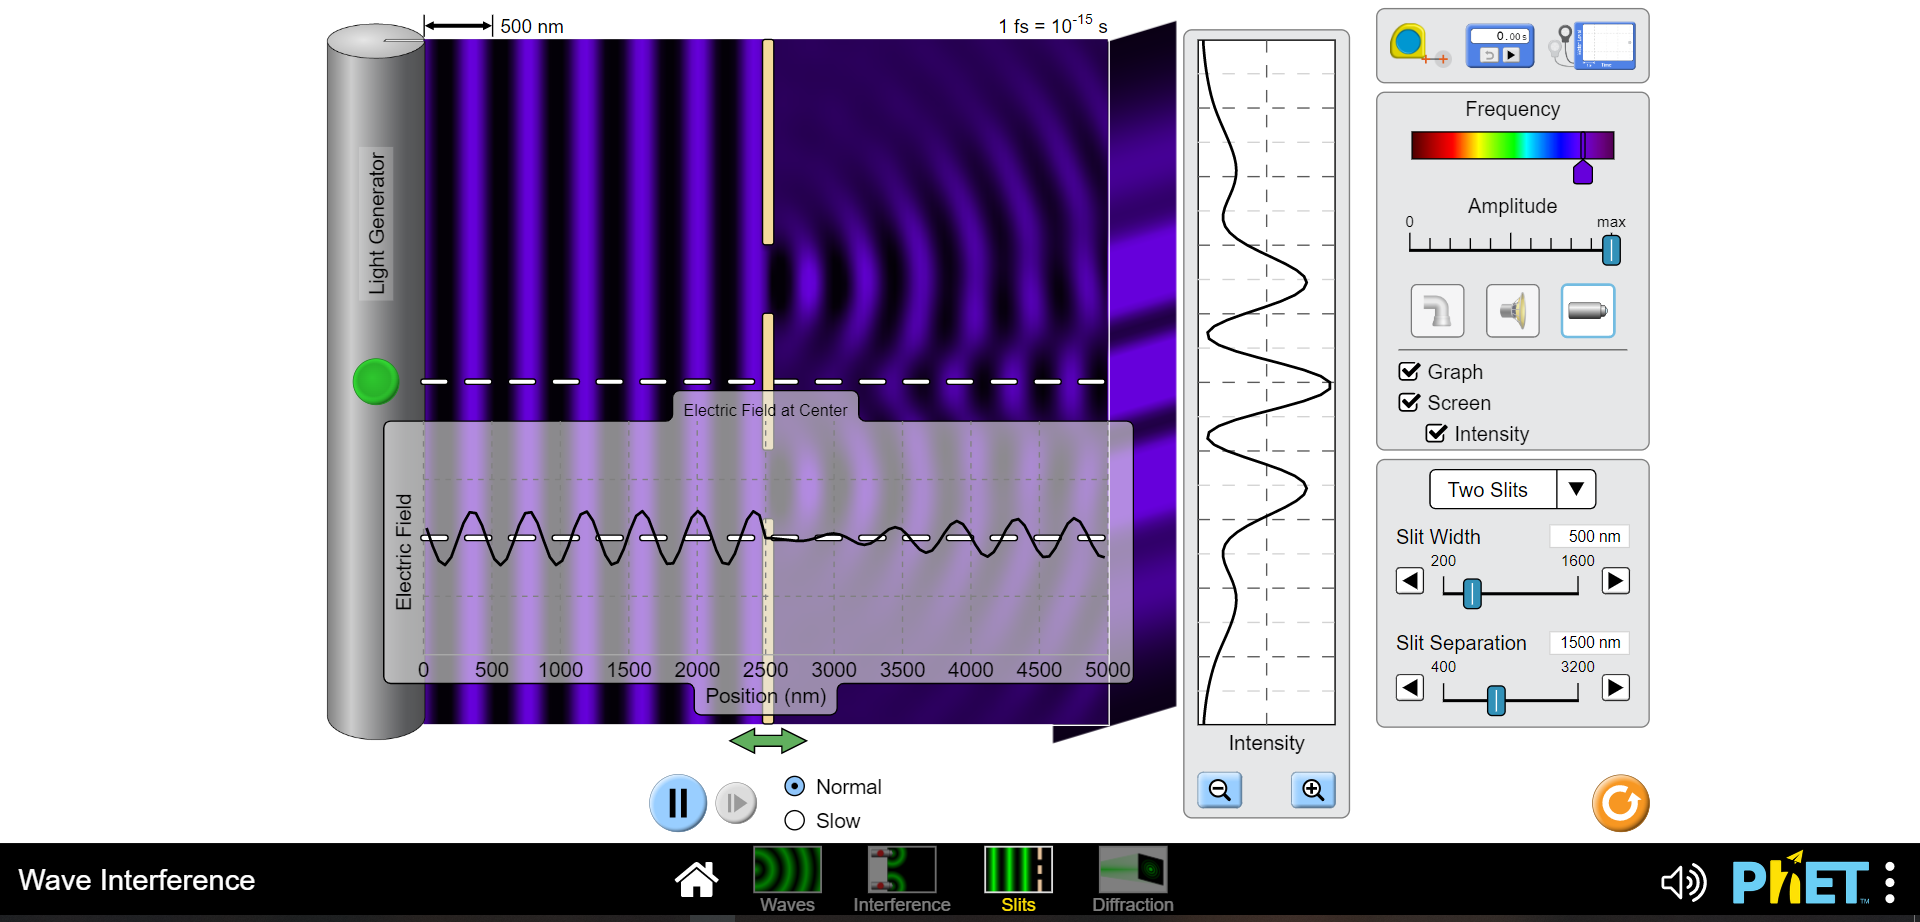

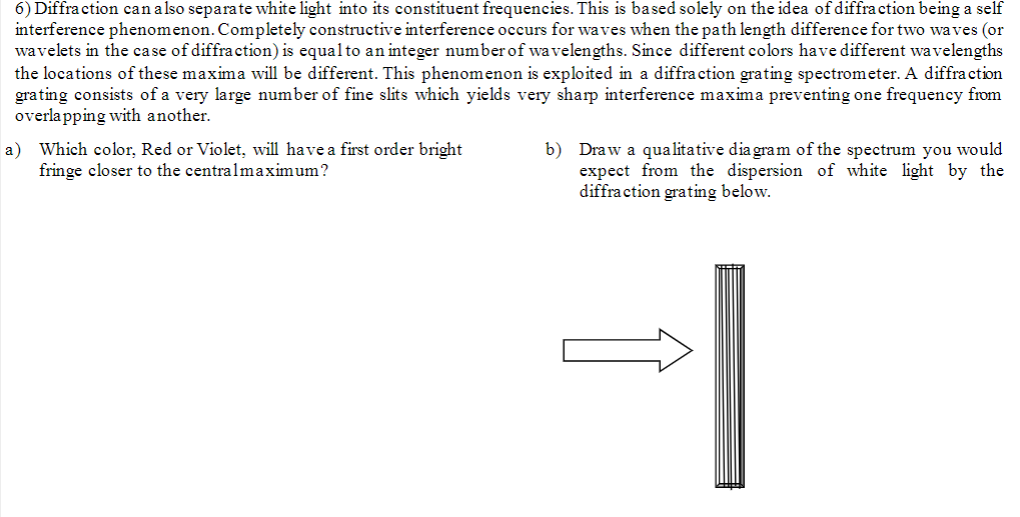
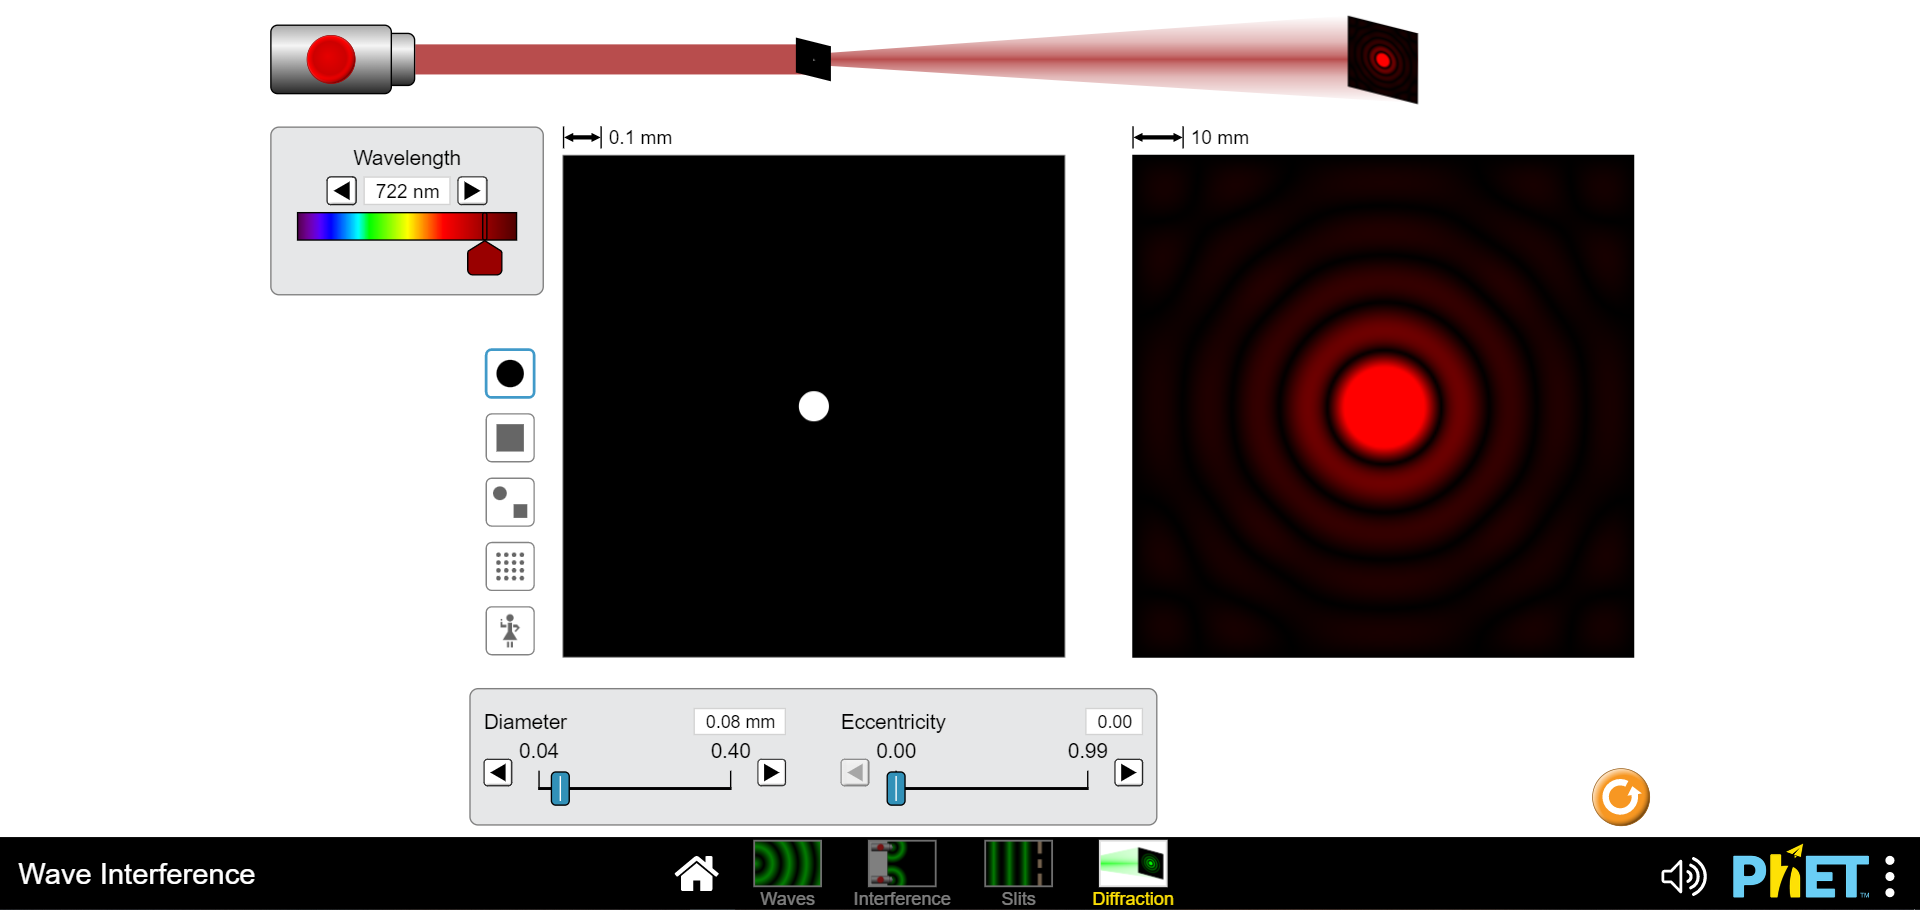
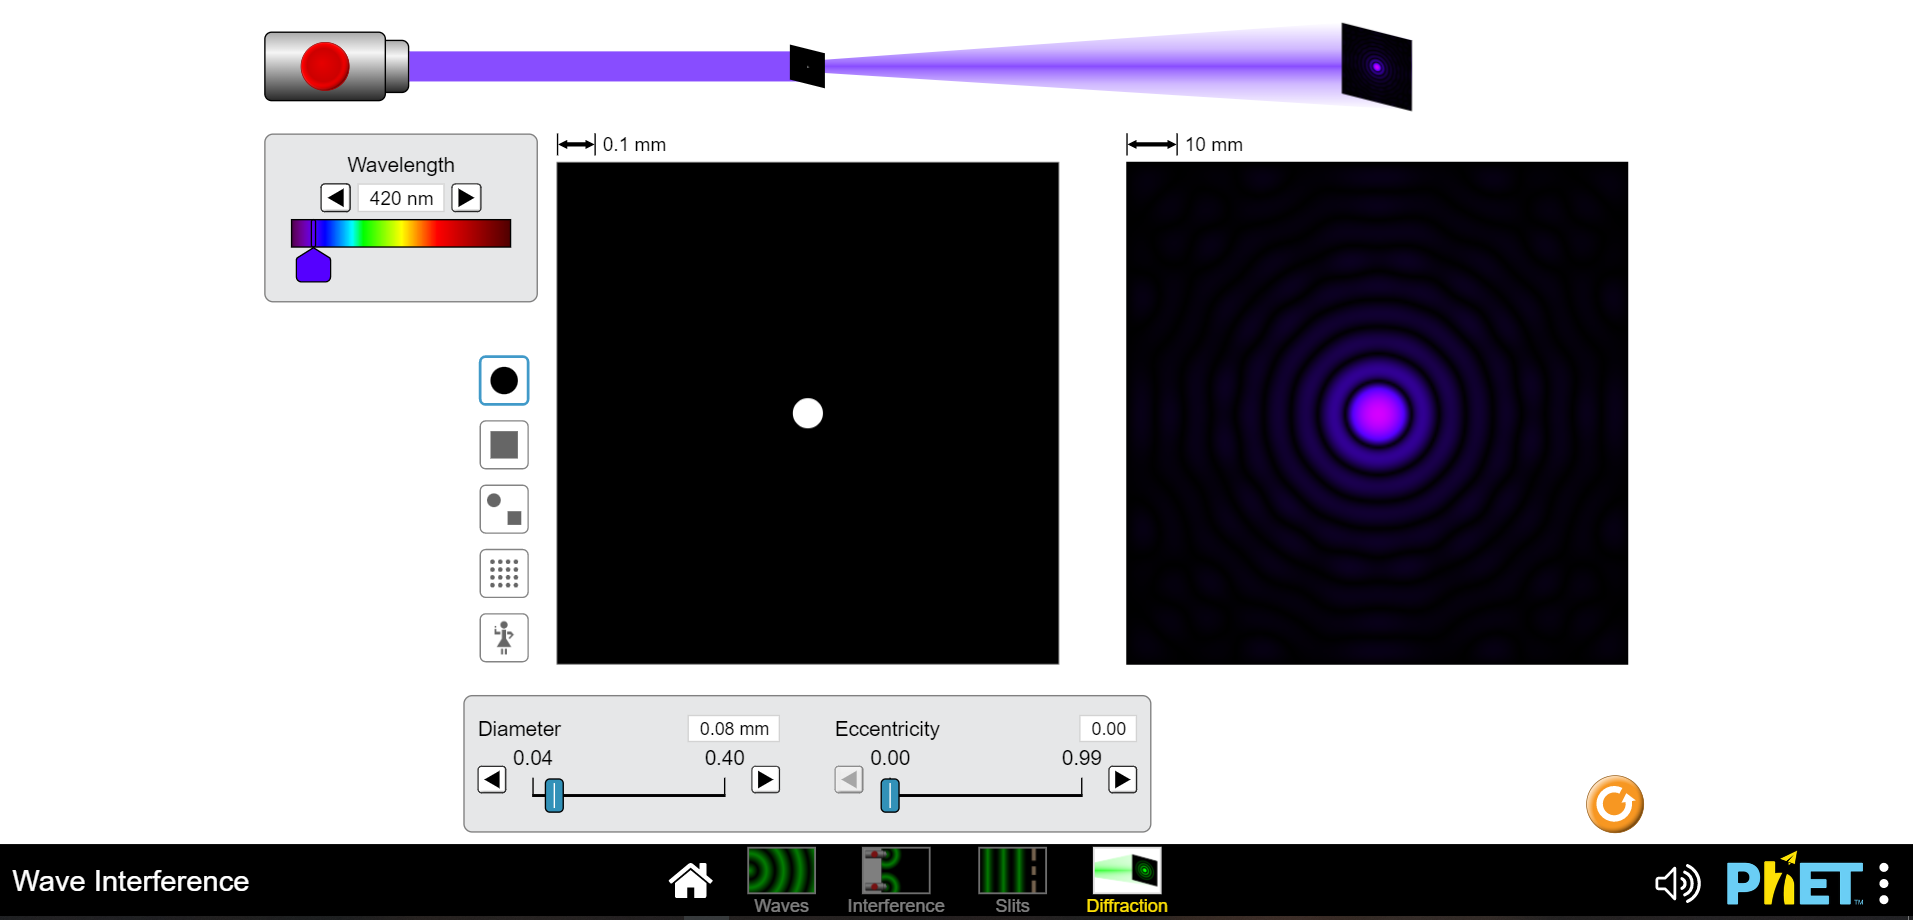

1) Waves including light and sound exhibit interference which is an effect of two or more waves being superimposed or added at the same location and time. This can be constructive such that the intensities of both wave combine to yield a higher intensity than each can produce independently or it can be completely destructive so no intensity is observed. (Of course anything in between these two extremes can also occur ;) a) Draw a diagram of two slits, each of width "a", separated c) Finally express "Ar" in terms of the wavelength of light used by a distance "d" and a screen "x" away from the plane of to illuminate these two slits for the two conditions of the slits. Pick a point on the screen above the higher slit completely constructive and destructive interference. and indicate the paths that two light waves would travel if one is coming from the center of the top slit "ri" and the other from the center of the bottom slit "12". d) Using your text draw an intensity vs. position plot of a two slit interference pattern and label the bright fringes according to the formula given in your text and lab manual for "y". Include the formulas for the locations of the interference minima and maxima. b) Without deriving anything just indicate on your diagram what the path length difference "Ar" is for the two waves you indicated previously. Now express "Ar" in terms of "r" and "r2".2) Please navigate to the "Interference" PHET here: b) What effect doeschanging the distance between the two sources https://phet.colorado.edu/en/simulations/wave-interference for maximum to minimum values have? Describe below. Explore with the water spigot point source, then the sound waves coming from two speakers and finally with the lasers. a) Click on the "graph" and "intensity". What is the biggest difference you see between the interference pattern shown on the screen from the red and violet light sources. c) Lastly vary the amplitude. What occurs when the amplitude is dialed down? Why do you think this occurs?500 nm 1 fs = 10-15 s O 0.00 5 Frequency Amplitude max Separation 1500 nm 500 4000 Electric Field at Center Graph AAS Screen Intensity Electric Field 0 500 1000 1500 2000 2500 3000 3500 4000 4500 5000 Position (nm) Intensity + II Normal O Slow Wave Interference N 1) PHET : Waves Interference Slits Diffraction500 nm 1 fs = 10-15 s 0.005 Frequency Amplitude max Separation 1500 nm 500 400 Electric Field at Center Graph Screen Intensity Electric Field 0 500 1000 1500 2000 2500 3000 3500 4000 4500 5000 Position (nm) Intensity II Normal + O Slow Wave Interference 4) PHET : Waves Interference Slits Diffraction500 nm 1 fs = 10-15 s 0.00 Frequency Amplitude o max TTTTTTTT Separation 500 nm 500 4000 Electric Field at Center Graph A Screen Intensity Electric Field 0 500 1000 1500 2000 2500 3000 3500 4000 4500 5000 Position (nm) Intensity Normal + II O Slow Wave Interference N ) PhET : Waves Interference Slits Diffraction500 nm 1 fs = 10-15 s 0.00 s Frequency Amplitude max TTT TTT Separation 4000 nm 500 4000 - - Electric Field at Center 7 Graph Screen Intensity Electric Field 500 1000 1500 2000 2500 3000 3500 4000 4500 5000 Position (nm) Intensity Normal + O Slow Wave Interference PRET : Way Slit Diffrac500 nm 1 fs = 10-13 s O 0.00 s Frequency Amplitude max Separation 500 nm 500 4000 Electric Field at Center Graph Screen Intensity Electric Field O 500 1000 1500 2000 2500 3000 3500 4000 4500 5000 Position (nm) Intensity Normal + O Slow Wave Interference H 4) PhET : Waves Interference Slits Diffraction500 nm 1 fs = 10-15 s 0.00s Frequency Amplitude max TITTTTTT Separation 4000 nm 500 4000 Electric Field at Center Graph Screen - - Intensity Electric Field 0 500 1000 1500 2000 2500 3000 3500 4000 4500 5000 Position (nm) Intensity Normal + O Slow Wave Interference N 1) PHET : Waves Interference Slits Diffraction500 nm 1 fs = 10-1 s 0.00 s Frequency Amplitude D max Separation 4000 nm 500 4000 - - Electric Field at Center 7 Graph _ Screen Intensity Electric Field O 500 1000 1500 2000 2500 3000 3500 4000 4500 5000 Position (nm) Intensity Normal + O Slow Wave Interference IH PhET :500 nm 1 fs = 10-15 s 0.00s Frequency Amplitude max TITTTTTT Separation 500 nm 500 4000 - - Electric Field at Center Graph Screen Intensity Electric Field 0 500 1000 1500 2000 2500 3000 3500 4000 4500 5000 Position (nm) Intensity Normal + O Slow Wave Interference H (4) PhET : Waves Interference Slits Diffraction3) Diffraction is more difficult to explain than interference. I like to call it "self interference". Indeed as it is as though the wavelets postulated by Huygens principle are all acting as individual waves which then interfere with each other to produce a pattern of varying intensity similar to an interference pattern. The essential difference being that this occurs with only one slit! Find the diagram of the intensity vs. screen position for single slit diffraction in yourtext and reproduce it here. Include the formula for the diffraction intensity minima.4) Please navigate to the "Slits" PHET here: https://phet.colorado.edu/en/simulations/wave-interference Explore with the water spigot point source, then the sound waves b) How does varying the slit width affect the diffraction pattem? coming from two speakers and finally with the lasers. a) Click on the "graph" and "intensity". What is the biggest difference you see between the diffraction pattern shown on the screen from the red and violet light sources. c) Now click to "two slits" and you will see the familiar interference pattern.|500 nm 1 fs = 10-15 s O 0.00 5 Frequency Amplitude max Light Generator TTTTTTT Graph Screen Electric Field at Center Intensity One Slit Slit Width 500 nm Electric Field 200 1600 -0 Slit Separation 1500 nm 400 3200 0 500 1000 1500 2000 2500 3000 3500 4000 4500 5000 Position (nm) Intensity Normal + O Slow Wave Interference N 4) PhET : Wave Interference Slits Diffraction500 nm 1 fs = 10-15 s 0.003 Frequency Amplitude max Light Generator UTTTTTTTTT Graph Screen Electric Field at Center Intensity One Slit Slit Width 500 nm Electric Field 200 1600 Slit Separation 1500 nm 1000 1500 2000 2500 3000 3500 4000 400 0 500 4500 5000 3200 Position (nm) Intensity Normal + O Slow Wave Interference 4) PHET : Waves Interference Slits Diffraction|500 nm 1 fs = 10-15 s 0.00s Frequency Amplitude max Light Generator TTT TTT Graph C Screen Electric Field at Center Intensity One Slit 1600 nm Electric Field AAf Slit Width 200 1600 Slit Separation 1500 nm 400 3200 0 500 1000 1500 2000 2500 3000 3500 4000 4500 5000 Position (nm) Intensity Normal + O Slow Wave Interference 4) PHET : Waves Interference Slits Diffraction500 nm 1 fs = 10-15 s 0.00 s -I- Frequency Amplitude max Light Generator Graph Electric Field at Center Screen Intensity One Slit Slit Width 200 nm Electric Field 200 1600 Slit Separation 1500 nm 1500 2000 2500 3000 3500 4500 5000 400 3200 0 500 1000 4000 Position (nm) Intensity Normal + O Slow Wave Interference () PhET :500 nm 1 fs = 10-13 s a 0.00S Frequency Amplitude max Light Generator Graph Screen Electric Field at Center Intensity One Slit V LAMA Slit Width 1600 nm 200 1600 Electric Field Slit Separation 1500 nm 400 3200 0 500 1000 1500 2000 2500 3000 3500 4000 4500 5000 D Position (nm) Intensity Normal + O Slow Wave Interference 1) PHET : Waves Interference Slits Diffraction500 nm 1 fs = 10-15 s 0.00 s Frequency Amplitude max Light Generator TITT Graph Screen Electric Field at Center Intensity One Slit Electric Field AAA Slit Width 200 nm 200 1600 Slit Separation 1500 nm 1000 1500 2000 2500 3000 3500 4000 4500 5000 400 320 0 500 Position (nm) Intensity Normal + O Slow Wave Interference () PhET :500 nm 1 fs = 10-15 s 0.00 s Frequency Amplitude max Light Generator TTTTTTTTT Graph - - - Screen Electric Field at Center Intensity Two Slits Slit Width 500 nm Electric Field 200 1600 Slit Separation 1500 nm 400 3200 500 1000 1500 2000 2500 3000 3500 4000 4500 5000 Position (nm) Intensity Normal + O Slow Wave Interference 1) PhET : Waves Interference Slits Diffraction500 nm 1 fs = 10-15 s O 0.00s -I- Frequency Amplitude max Light Generator 7 Graph - Screen Electric Field at Center Intensity Two Slits Slit Width 500 nm 200 160 Electric Field Slit Separation 1500 nm 400 3200 0 500 1000 1500 2000 2500 3000 3500 4000 4500 5000 Position (nm) Intensity II Normal + O Slow Wave Interference (1) PhET : Waves Interference Slits Diffraction5) In which pattern, interference or diffraction, are the minima or dark fringes spaced further apart? Using this information draw a qualitative graph of what the intensity pattern of realtwo slit interference might look like if both interference and diffraction are evident6) Diffraction can also separate white light into its constituent frequencies. This is based solely on the idea of diffraction being a self interference phenomenon. Completely constructive interference occurs for waves when the path length difference for two waves (or wavelets in the case of diffraction) is equal to an integer number of wavelengths. Since different colors have different wavelengths the locations of these maxima will be different. This phenomenon is exploited in a diffraction grating spectrometer. A diffraction grating consists of a very large number of fine slits which yields very sharp interference maxima preventing one frequency from overlapping with another. a) Which color, Red or Violet, will have a first order bright b) Draw a qualitative diagram of the spectrum you would fringe closer to the centralmaximum? expect from the dispersion of white light by the diffraction grating below.7) Please navigate to the "Diffraction" PHET here: https:/phet.colorado.edu/en/simulations/wave-interference Explore diffraction with the various apertures available. What light frequency gives the clearest ie least fuzzy image? (Red or Violet)
Step by Step Solution
There are 3 Steps involved in it

Get step-by-step solutions from verified subject matter experts