Question
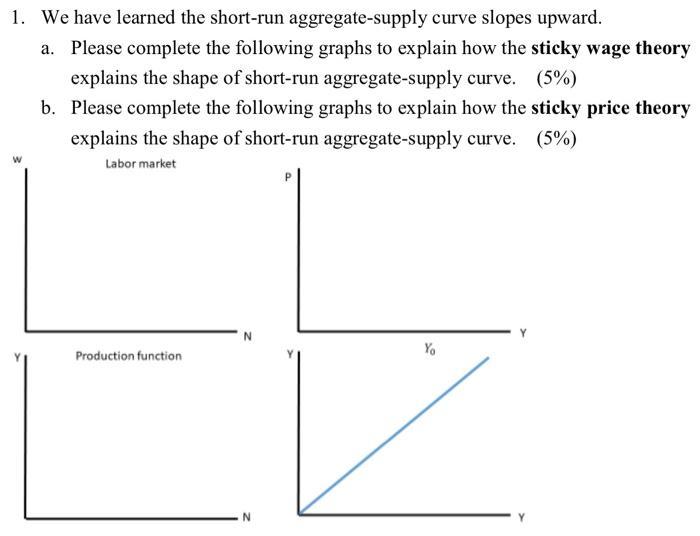
1. We have learned the short-run aggregate-supply curve slopes upward. a. Please complete the following graphs to explain how the sticky wage theory explains

1. We have learned the short-run aggregate-supply curve slopes upward. a. Please complete the following graphs to explain how the sticky wage theory explains the shape of short-run aggregate-supply curve. (5%) b. Please complete the following graphs to explain how the sticky price theory explains the shape of short-run aggregate-supply curve. (5%) Labor market Production function. N N Yo
Step by Step Solution
There are 3 Steps involved in it
Step: 1
ANSWER Through the Sticky wage theory with a stuck nomina...
Get Instant Access to Expert-Tailored Solutions
See step-by-step solutions with expert insights and AI powered tools for academic success
Step: 2

Step: 3

Ace Your Homework with AI
Get the answers you need in no time with our AI-driven, step-by-step assistance
Get StartedRecommended Textbook for
Microeconomics An Intuitive Approach with Calculus
Authors: Thomas Nechyba
1st edition
538453257, 978-0538453257
Students also viewed these Economics questions
Question
Answered: 1 week ago
Question
Answered: 1 week ago
Question
Answered: 1 week ago
Question
Answered: 1 week ago
Question
Answered: 1 week ago
Question
Answered: 1 week ago
Question
Answered: 1 week ago
Question
Answered: 1 week ago
Question
Answered: 1 week ago
Question
Answered: 1 week ago
Question
Answered: 1 week ago
Question
Answered: 1 week ago
Question
Answered: 1 week ago
Question
Answered: 1 week ago
Question
Answered: 1 week ago
Question
Answered: 1 week ago
Question
Answered: 1 week ago
Question
Answered: 1 week ago
Question
Answered: 1 week ago
Question
Answered: 1 week ago
Question
Answered: 1 week ago
Question
Answered: 1 week ago
Question
Answered: 1 week ago
View Answer in SolutionInn App


