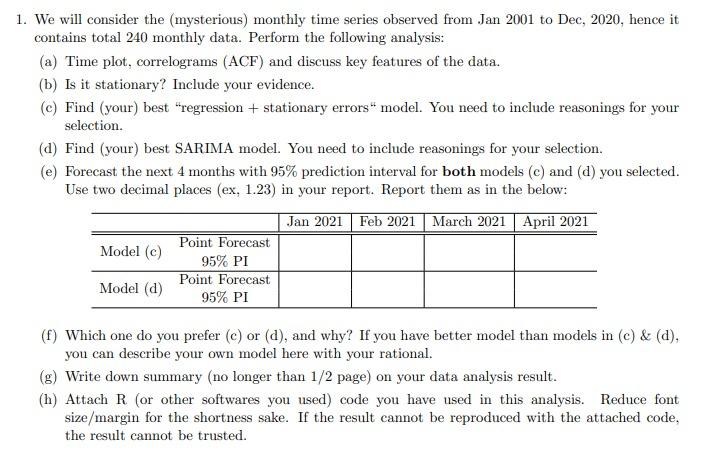
1. We will consider the (mysterious) monthly time series observed from Jan 2001 to Dec, 2020, hence it contains total 240 monthly data. Perform the following analysis: (a) Time plot, correlograms (ACF) and discuss key features of the data. (b) Is it stationary? Include your evidence. (c) Find (your) best "regression + stationary errors" model. You need to include reasonings for your selection. (d) Find (your) best SARIMA model. You need to include reasonings for your selection. (e) Forecast the next 4 months with 95% prediction interval for both models (c) and (d) you selected. Use two decimal places (ex, 1.23) in your report. Report them as in the below: Jan 2021 Feb 2021 March 2021 April 2021 Point Forecast Model (c) 95% PI Model (d) Point Forecast 95% PI (f) Which one do you prefer (c) or (d), and why? If you have better model than models in (c) & (d), you can describe your own model here with your rational. (g) Write down summary (no longer than 1/2 page) on your data analysis result. (h) Attach R. (or other softwares you used) code you have used in this analysis. Reduce font size/margin for the shortness sake. If the result cannot be reproduced with the attached code, the result cannot be trusted. 1. We will consider the (mysterious) monthly time series observed from Jan 2001 to Dec, 2020, hence it contains total 240 monthly data. Perform the following analysis: (a) Time plot, correlograms (ACF) and discuss key features of the data. (b) Is it stationary? Include your evidence. (c) Find (your) best "regression + stationary errors" model. You need to include reasonings for your selection. (d) Find (your) best SARIMA model. You need to include reasonings for your selection. (e) Forecast the next 4 months with 95% prediction interval for both models (c) and (d) you selected. Use two decimal places (ex, 1.23) in your report. Report them as in the below: Jan 2021 Feb 2021 March 2021 April 2021 Point Forecast Model (c) 95% PI Model (d) Point Forecast 95% PI (f) Which one do you prefer (c) or (d), and why? If you have better model than models in (c) & (d), you can describe your own model here with your rational. (g) Write down summary (no longer than 1/2 page) on your data analysis result. (h) Attach R. (or other softwares you used) code you have used in this analysis. Reduce font size/margin for the shortness sake. If the result cannot be reproduced with the attached code, the result cannot be trusted


