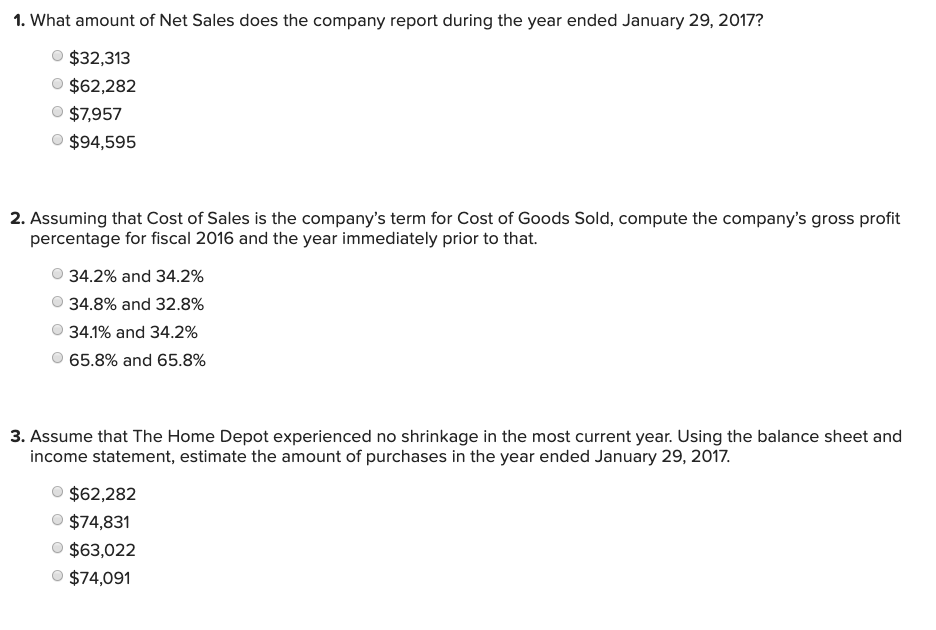
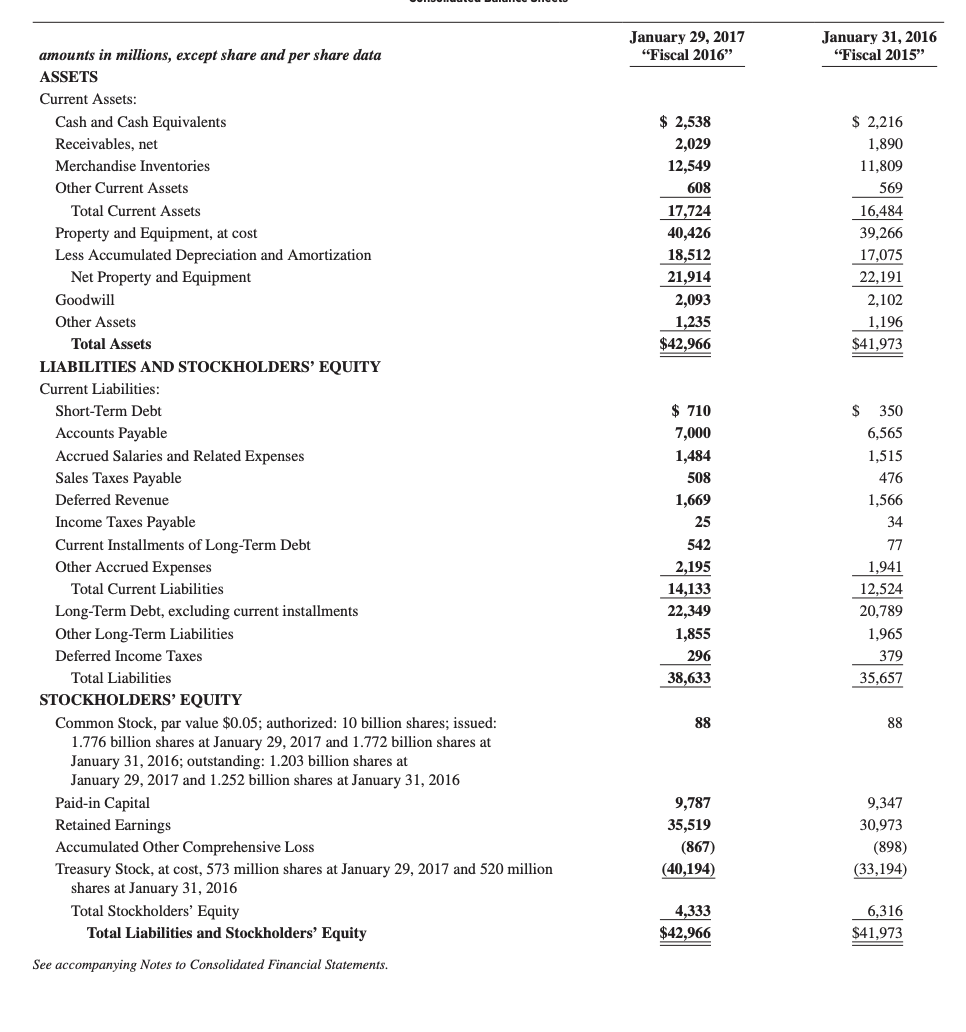
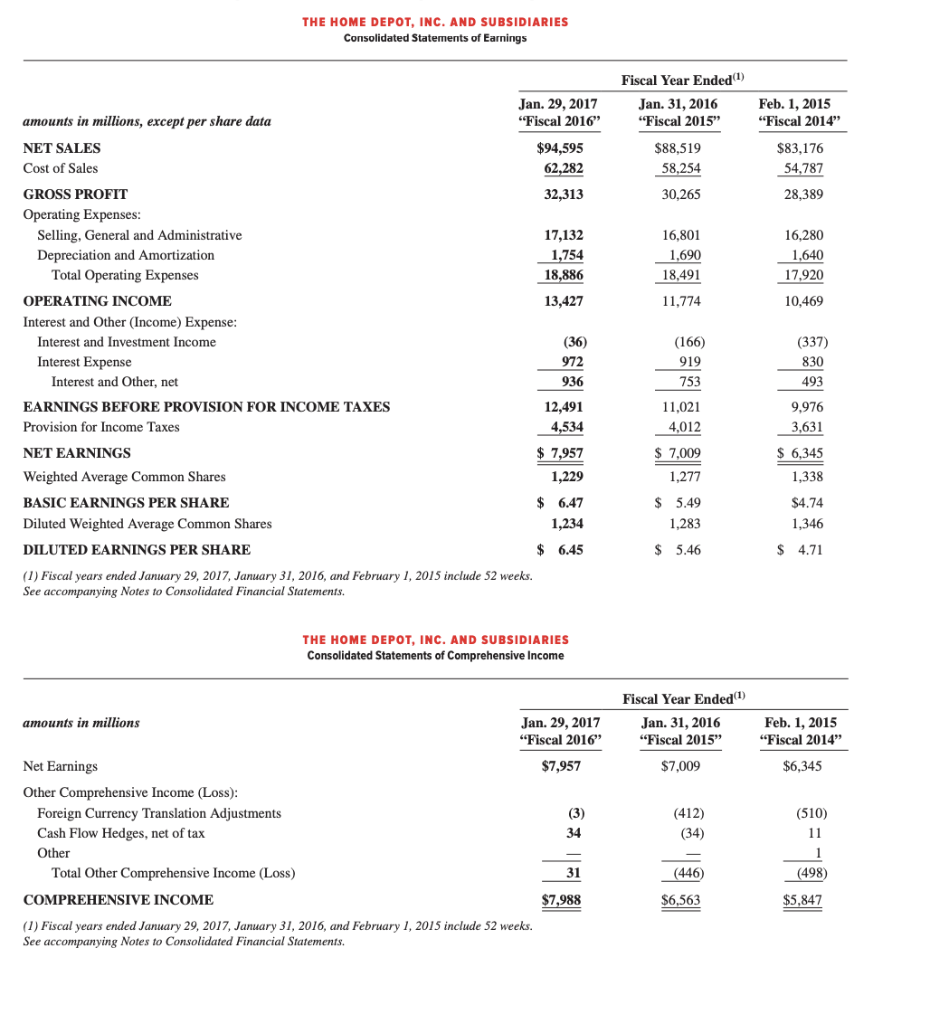
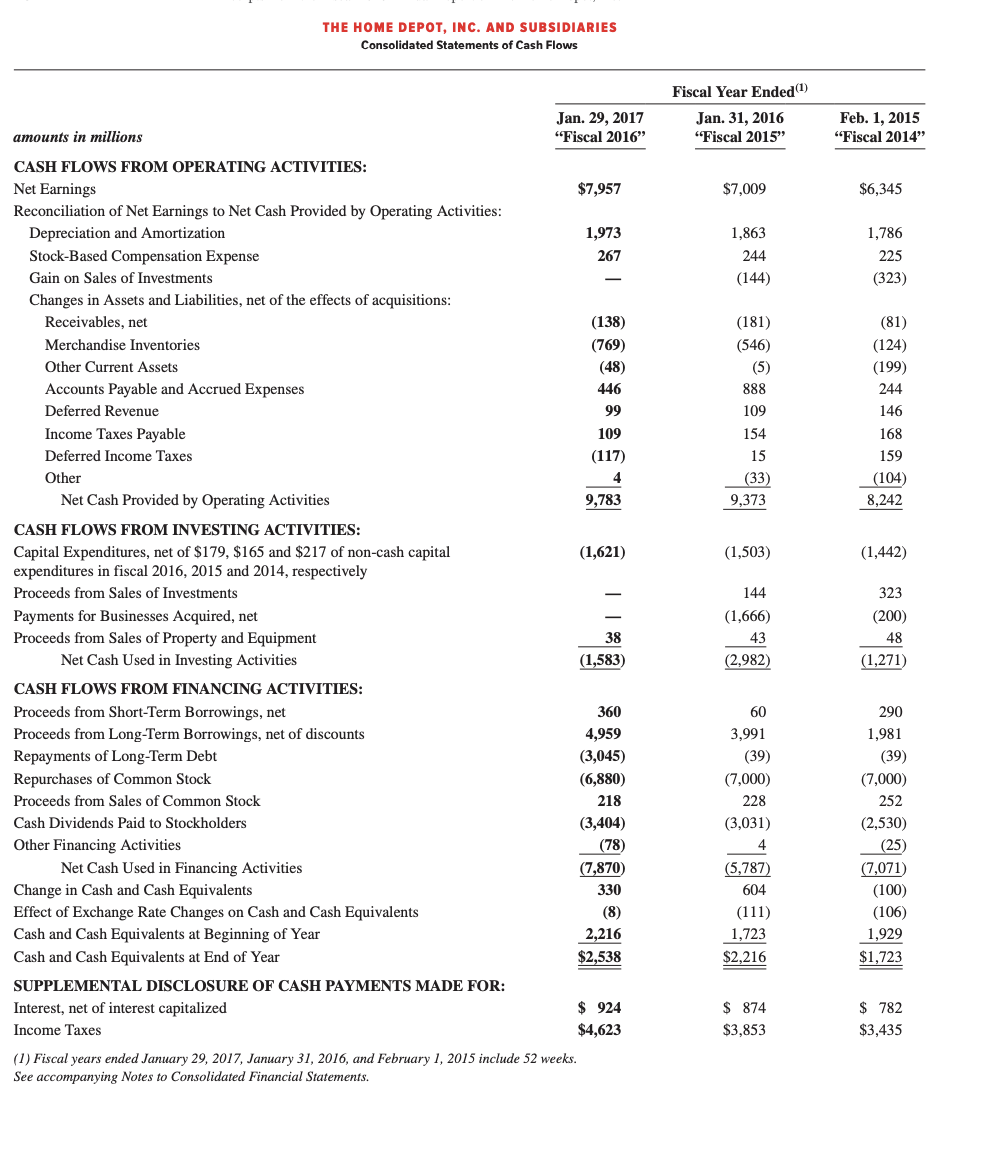
1. What amount of Net Sales does the company report during the year ended January 29, 2017? $32,313 $62,282 $7,957 $94,595 2. Assuming that Cost of Sales is the company's term for Cost of Goods Sold, compute the company's gross profit percentage for fiscal 2016 and the year immediately prior to that. 34.2% and 34.2% 34.8% and 32.8% 34.1% and 34.2% 65.8% and 65.8% 3. Assume that The Home Depot experienced no shrinkage in the most current year. Using the balance sheet and income statement, estimate the amount of purchases in the year ended January 29, 2017. $62,282 $74,831 $63,022 $74,091 January 29, 2017 "Fiscal 2016" January 31, 2016 "Fiscal 2015" $ 2,538 2,029 12,549 608 17,724 40,426 18,512 21,914 2,093 1,235 $42,966 $ 2,216 1,890 11,809 569 16,484 39,266 17,075 22,191 2,102 1,196 $41,973 $ $ 710 7,000 1,484 508 1,669 350 6,565 1,515 476 1,566 amounts in millions, except share and per share data ASSETS Current Assets: Cash and Cash Equivalents Receivables, net Merchandise Inventories Other Current Assets Total Current Assets Property and Equipment, at cost Less Accumulated Depreciation and Amortization Net Property and Equipment Goodwill Other Assets Total Assets LIABILITIES AND STOCKHOLDERS' EQUITY Current Liabilities: Short-Term Debt Accounts Payable Accrued Salaries and Related Expenses Sales Taxes Payable Deferred Revenue Income Taxes Payable Current Installments of Long-Term Debt Other Accrued Expenses Total Current Liabilities Long-Term Debt, excluding current installments Other Long-Term Liabilities Deferred Income Taxes Total Liabilities STOCKHOLDERS' EQUITY Common Stock, par value $0.05; authorized: 10 billion shares; issued: 1.776 billion shares at January 29, 2017 and 1.772 billion shares at January 31, 2016; outstanding: 1.203 billion shares at January 29, 2017 and 1.252 billion shares at January 31, 2016 Paid-in Capital Retained Earnings Accumulated Other Comprehensive Loss Treasury Stock, at cost, 573 million shares at January 29, 2017 and 520 million shares at January 31, 2016 Total Stockholders' Equity Total Liabilities and Stockholders' Equity See accompanying Notes to Consolidated Financial Statements. 34 77 542 2,195 14,133 22,349 1,855 296 38,633 1,941 12,524 20,789 1,965 379 35,657 88 88 9,787 35,519 (867) (40,194) 9,347 30,973 (898) (33,194) 4,333 $42,966 6,316 $41,973 THE HOME DEPOT, INC. AND SUBSIDIARIES Consolidated Statements of Earnings Fiscal Year Ended(1) Jan. 31, 2016 "Fiscal 2015" Jan. 29, 2017 "Fiscal 2016" amounts in millions, except per share data Feb. 1, 2015 "Fiscal 2014" $88,519 58,254 $83,176 54,787 30,265 28,389 16,801 1,690 18,491 16,280 1,640 17,920 11,774 10,469 972 NET SALES $94,595 Cost of Sales 62,282 GROSS PROFIT 32,313 Operating Expenses: Selling, General and Administrative 17,132 Depreciation and Amortization 1,754 Total Operating Expenses 18,886 OPERATING INCOME 13,427 Interest and Other (Income) Expense: Interest and Investment Income (36) Interest Expense Interest and Other, net 936 EARNINGS BEFORE PROVISION FOR INCOME TAXES 12,491 Provision for Income Taxes 4,534 NET EARNINGS $ 7,957 Weighted Average Common Shares 1,229 BASIC EARNINGS PER SHARE $ 6.47 Diluted Weighted Average Common Shares 1,234 DILUTED EARNINGS PER SHARE $ 6.45 (1) Fiscal years ended January 29, 2017, January 31, 2016, and February 1, 2015 include 52 weeks. See accompanying Notes to Consolidated Financial Statements. (166) 919 753 (337) 830 493 11,021 4,012 9,976 3,631 $ 7,009 $ 6,345 1,338 1,277 $ 5.49 1,283 $ 5.46 $4.74 1,346 4.71 $ THE HOME DEPOT, INC. AND SUBSIDIARIES Consolidated Statements of Comprehensive Income amounts in millions Jan. 29, 2017 "Fiscal 2016" $7,957 Fiscal Year Ended(1) Jan. 31, 2016 "Fiscal 2015 Feb. 1, 2015 Fiscal 2014" $7,009 $6,345 Net Earnings Other Comprehensive Income (Loss): Foreign Currency Translation Adjustments Cash Flow Hedges, net of tax Other Total Other Comprehensive Income (Loss) (412) (510) 34 (34) 11 (446) (498) COMPREHENSIVE INCOME $7,988 $6,563 $5,847 (1) Fiscal years ended January 29, 2017, January 31, 2016, and February 1, 2015 include 52 weeks. See accompanying Notes to Consolidated Financial Statements. THE HOME DEPOT, INC. AND SUBSIDIARIES Consolidated Statements of Cash Flows Jan. 29, 2017 "Fiscal 2016" Fiscal Year Ended (1) Jan. 31, 2016 "Fiscal 2015" Feb. 1, 2015 "Fiscal 2014" amounts in millions $7,009 $6,345 1,863 244 (144) 1,786 225 (323) (769) (181) (546) (5) 888 (81) (124) (199) 244 146 168 99 109 154 15 159 (104) (33) 9,373 8,242 (1,503) (1,442) CASH FLOWS FROM OPERATING ACTIVITIES: Net Earnings $7,957 Reconciliation of Net Earnings to Net Cash Provided by Operating Activities: Depreciation and Amortization 1,973 Stock-Based Compensation Expense 267 Gain on Sales of Investments Changes in Assets and Liabilities, net of the effects of acquisitions: Receivables, net (138) Merchandise Inventories Other Current Assets (48) Accounts Payable and Accrued Expenses 446 Deferred Revenue Income Taxes Payable 109 Deferred Income Taxes (117) Other Net Cash Provided by Operating Activities 9,783 CASH FLOWS FROM INVESTING ACTIVITIES: Capital Expenditures, net of $179, $165 and $217 of non-cash capital (1,621) expenditures in fiscal 2016, 2015 and 2014, respectively Proceeds from Sales of Investments Payments for Businesses Acquired, net Proceeds from Sales of Property and Equipment 38 Net Cash Used in Investing Activities (1,583) CASH FLOWS FROM FINANCING ACTIVITIES: Proceeds from Short-Term Borrowings, net 360 Proceeds from Long-Term Borrowings, net of discounts 4,959 Repayments of Long-Term Debt (3,045) Repurchases of Common Stock (6,880) Proceeds from Sales of Common Stock 218 Cash Dividends Paid to Stockholders (3,404) Other Financing Activities (78) Net Cash Used in Financing Activities (7,870) Change in Cash and Cash Equivalents 330 Effect of Exchange Rate Changes on Cash and Cash Equivalents Cash and Cash Equivalents at Beginning of Year 2,216 Cash and Cash Equivalents at End of Year $2,538 SUPPLEMENTAL DISCLOSURE OF CASH PAYMENTS MADE FOR: Interest, net of interest capitalized $ 924 Income Taxes $4,623 (1) Fiscal years ended January 29, 2017, January 31, 2016, and February 1, 2015 include 52 weeks. See accompanying Notes to Consolidated Financial Statements. 144 (1,666) 323 (200) 48 (1,271) 43 (2,982) 60 290 3,991 1,981 (39) (7,000) 228 (3,031) (39) (7,000) 252 (2,530) (25) (7,071) (100) (106) 1,929 $1,723 (5,787) 604 (111) 1,723 $2,216 (8) $ 874 $3,853 $ 782 $3,435