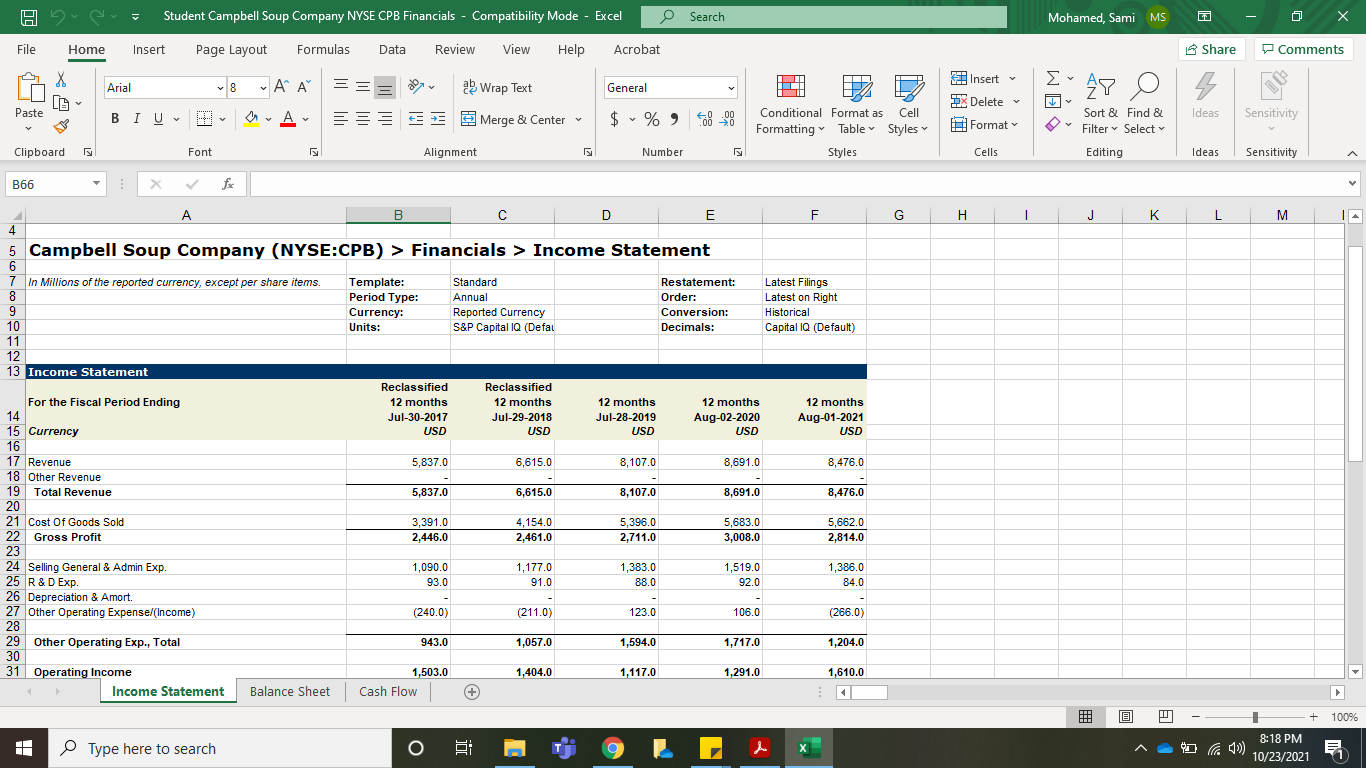
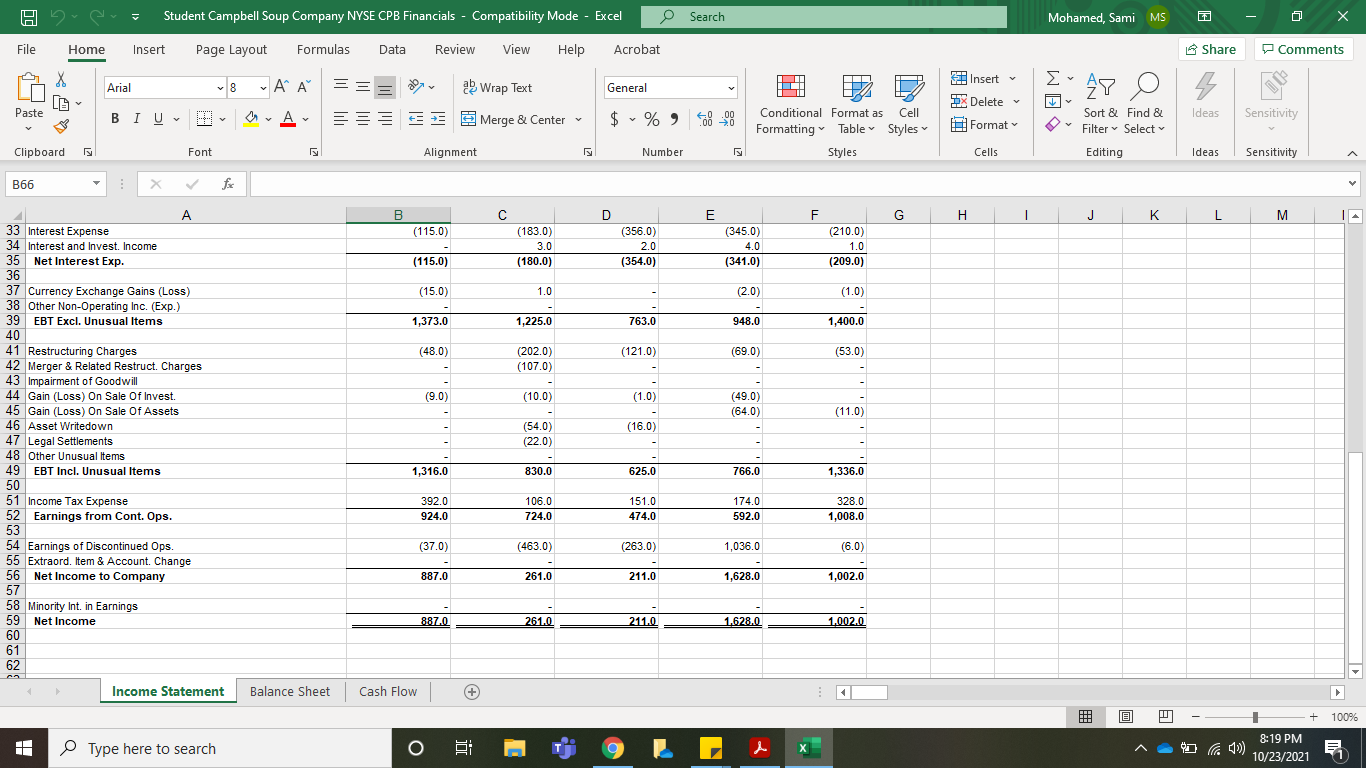
1) What has been the percentage change in Total Revenue, Gross Profit, Operating Income (EBIT) and Net Income for each of the most recent four years? Please comment on the trends.
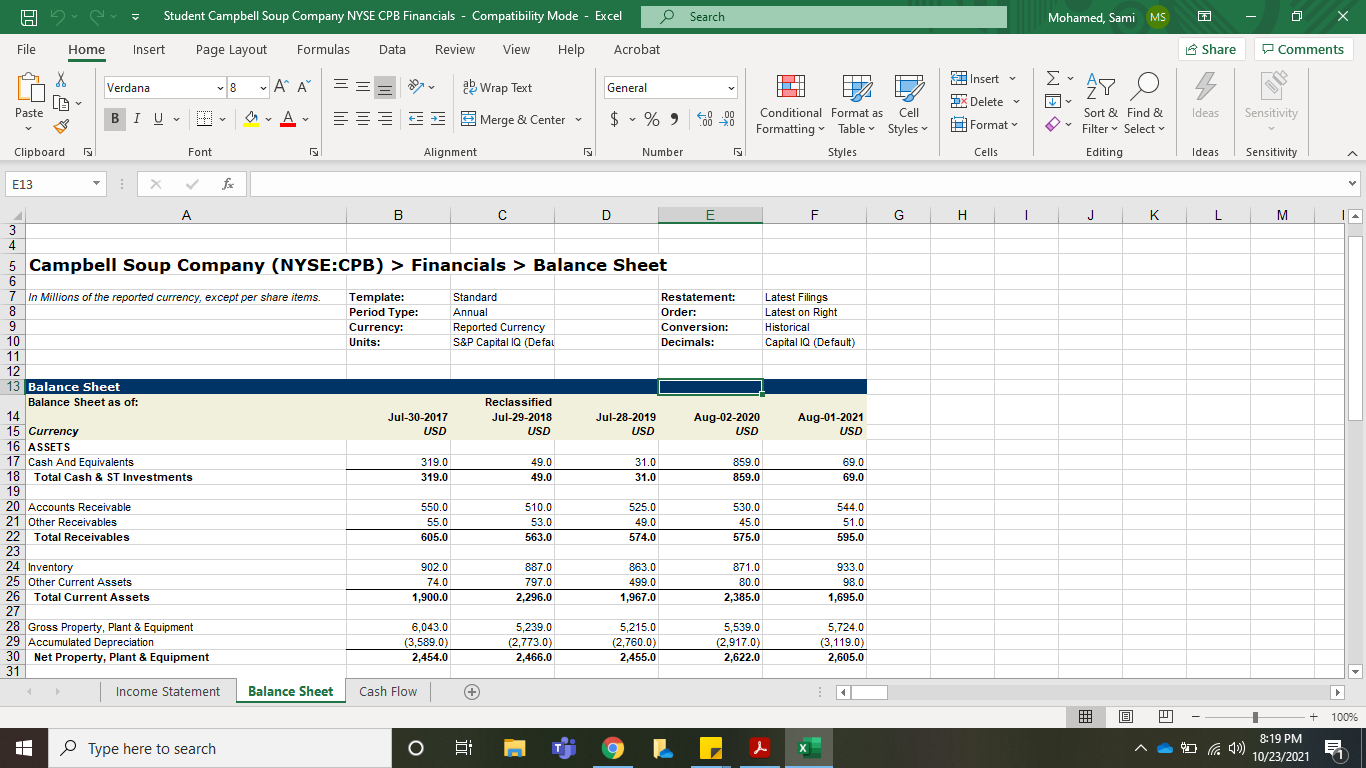
2.) What has been the companys Current Ratio and Quick Ratio for each of the past five years, and how would you interpret the results?
3.) What has been the companys Total Asset Turnover and Inventory Turnover for the past five years? In your own words, how would you interpret the results?
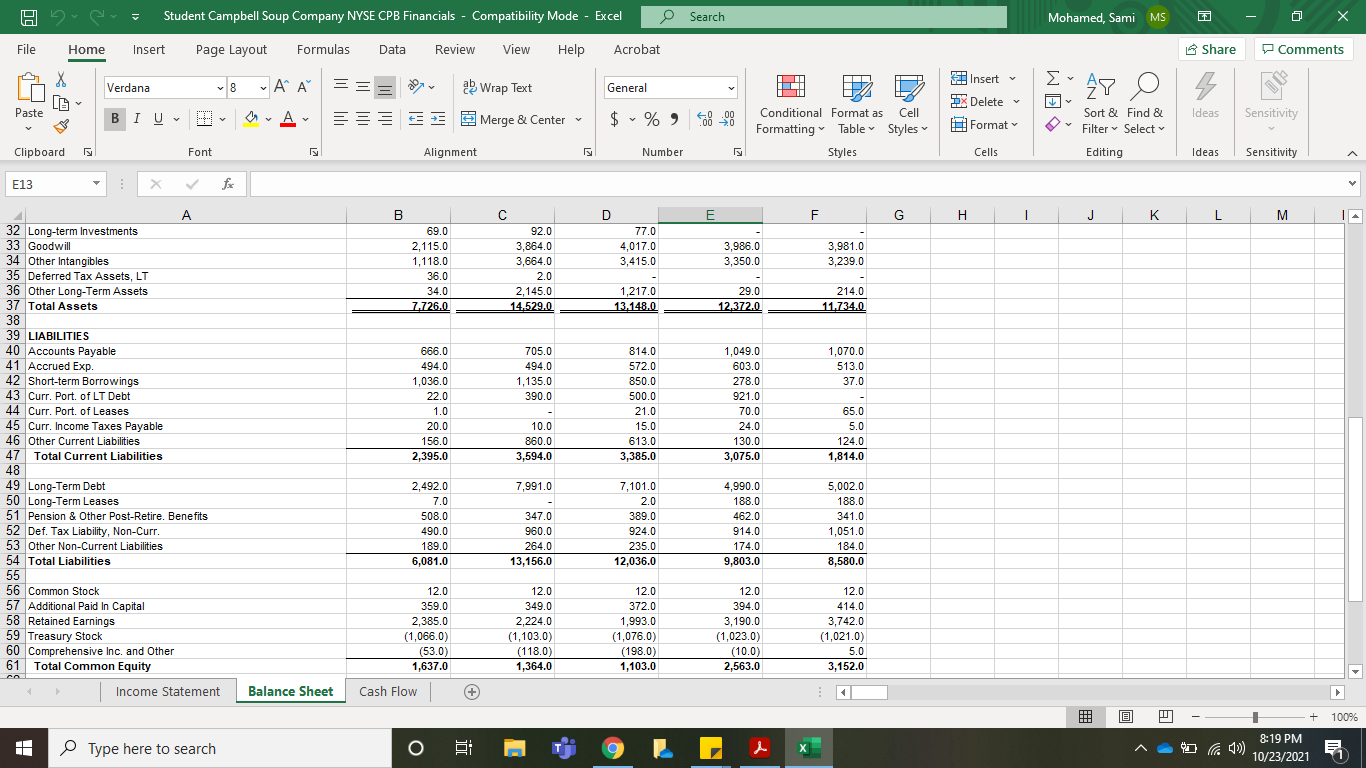
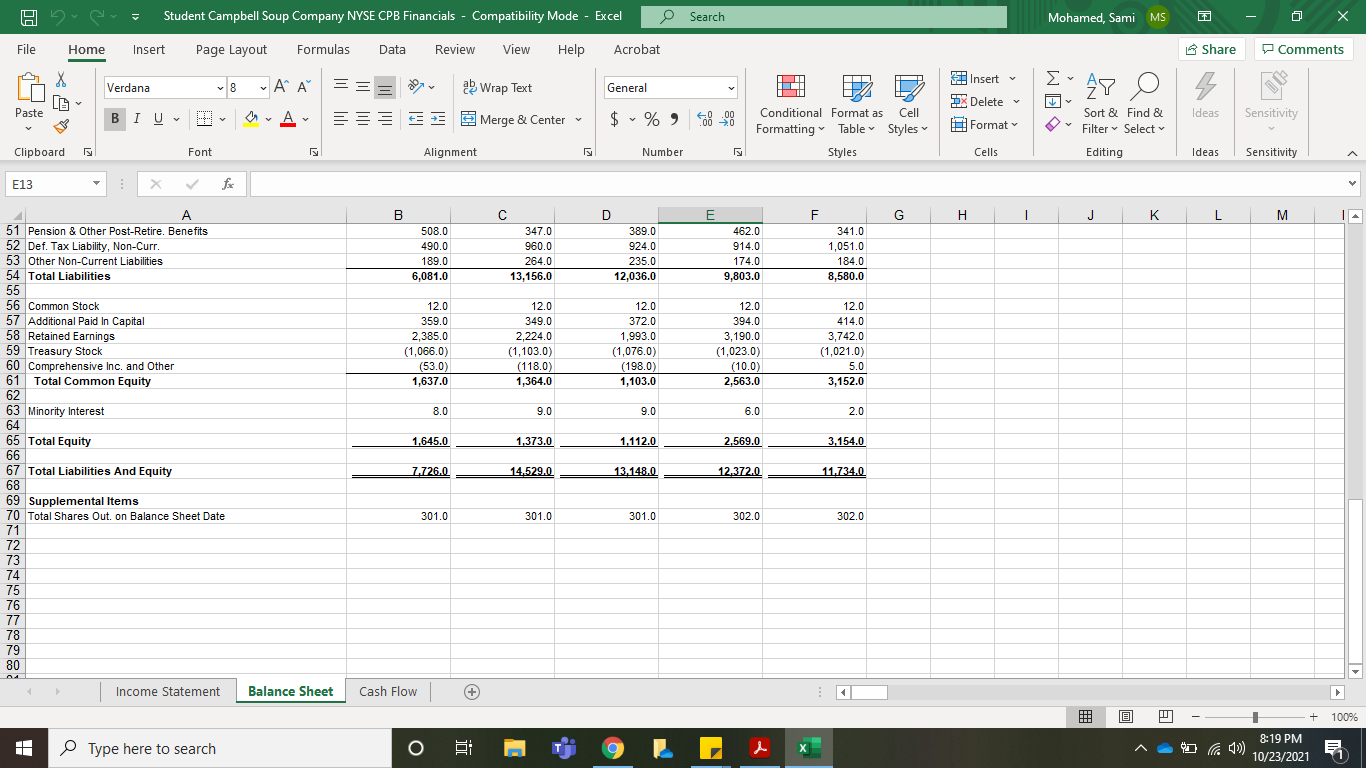
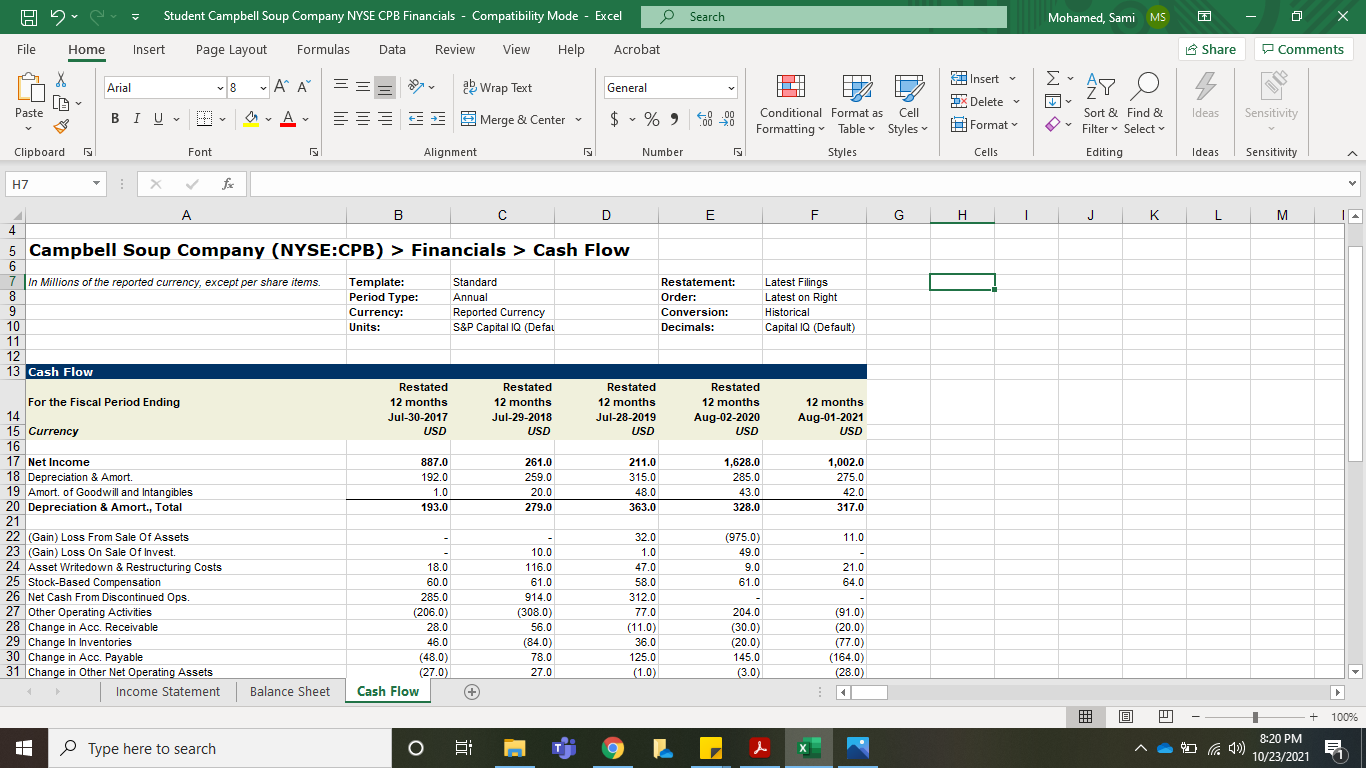
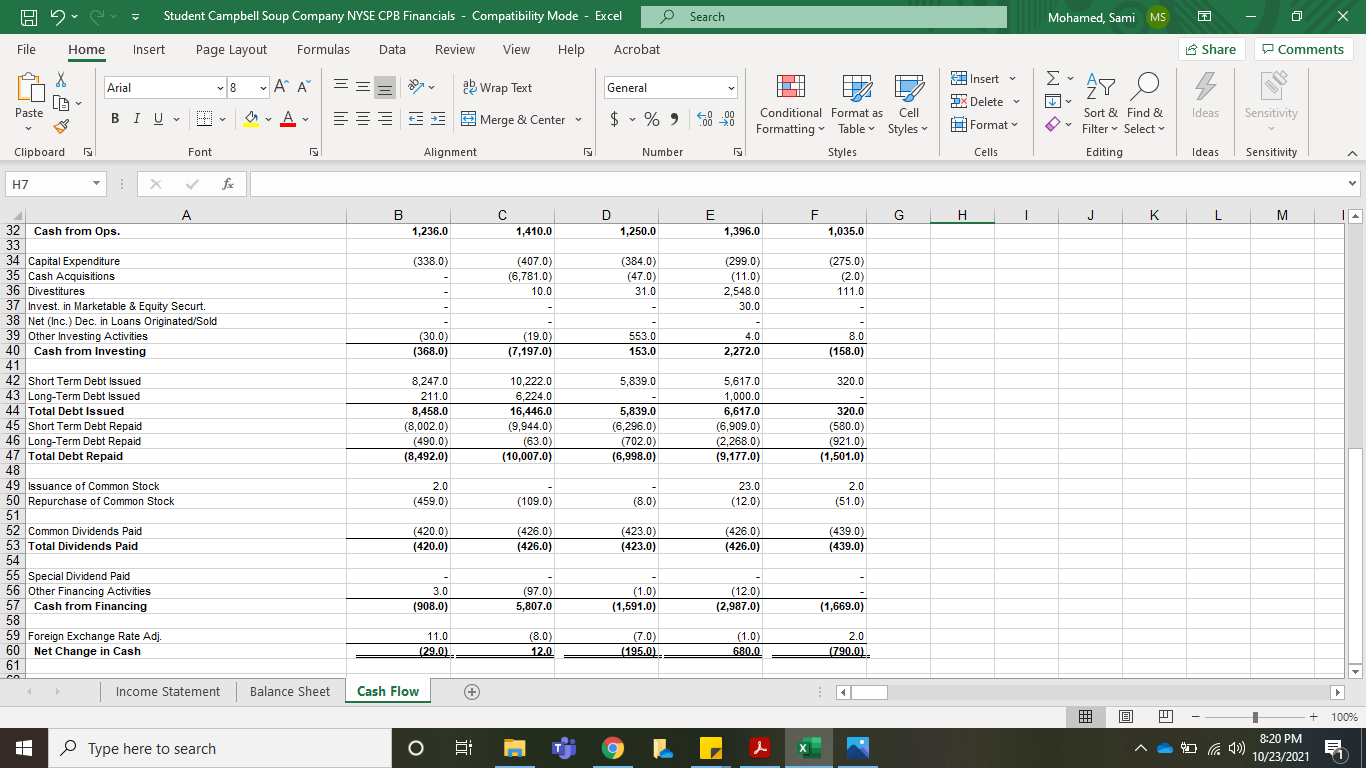
H Student Campbell Soup Company NYSE CPB Financials - Compatibility Mode - Excel Search Mohamed, Sami MS File Home Insert Page Layout Formulas Data Review View Help Acrobat Share Comments X Insert Arial 8 8 - A ab == a Wrap Text General AY O 3 9X Delete Paste BIU A Ideas y 3 Merge & Center y Sensitivity $ % .00 Format Conditional Format as Cell Formatting Table Styles Styles Sort & Find & Filter Select Editing Clipboard Font Alignment Number Cells Ideas Sensitivity B66 X for . A B C D E F G H H J K L M M 4 5 Campbell Soup Company (NYSE:CPB) > Financials > Income Statement 7 In Millions of the reported currency, except per share items 56789BHUB Template: Period Type: Currency: Units: Standard Annual Reported Currency S&P Capital IQ (Defal Restatement: Order: Conversion: : Decimals: Latest Filings Latest on Right Historical Capital IQ (Default) 10 11 12 13 Income Statement Reclassified 12 months Jul-30-2017 USD Reclassified 12 months Jul-29-2018 USD 12 months Jul-28-2019 USD 12 months Aug-02-2020 USD 12 months Aug-01-2021 USD 5,837,0 6,615.0 8,107.0 8,691.0 8,476.0 5,837.0 6,615.0 8,107.0 8,691.0 8,476.0 3,391.0 2,446.0 4,154.0 2,461.0 5,396,0 2,711.0 5,683.0 3,008.0 5,662,0 2,814.0 For the Fiscal Period Ending 14 15 Currency 16 17 Revenue 18 Other Revenue 19 Total Revenue 20 21 Cost Of Goods Sold 22 Gross Profit 23 24 Selling General & Admin Exp. 25 R & D Exp. 26 Depreciation & Amort. 27 Other Operating Expense/(Income) 28 29 Other Operating Exp., Total 30 31 Operating Income Income Statement 1,090.0 93.0 1,177,0 91.0 1,383.0 88.0 1,519.0 92.0 1,386.0 84.0 (240.0) (211.0) 123.0 106.0 (266.0) 943.0 1,057.0 1,594.0 1,717.0 1,204.0 1,404.0 1,117.0 1,291.0 1,610.0 1,503.0 Cash Flow Balance Sheet + + 100% Type here to search O o . d d)) 8:18 PM 10/23/2021 C H Student Campbell Soup Company NYSE CPB Financials - Compatibility Mode - Excel Search Mohamed, Sami MS File Home Insert Page Layout Formulas Data Review View Help Acrobat Share Comments X Insert Arial 8 8 - A ab == General 3 AY O Wrap Text 3 Merge & Center 9X Delete WS Paste BIU A Ideas y Sensitivity $ %): y .000 Format Conditional Format as Cell Formatting Table Styles Styles Sort & Find & Filter Select Editing Clipboard Font Alignment Number Cells Ideas Sensitivity B66 X fic B D F F G H H 1 J K L M (115.0) (183.0) 3.0 (180.0) (356.0) 2.0 (354.0) (345.0) 4.0 (341.0) (210.0) 1.0 (209.0) (115.0) (15.0) 1.0 (2.0) (1.0) 1,373.0 1,225.0 763.0 948.0 1,400.0 (48.0) (121.0) (202.0) (107.0) (69.0) (53.0) - (9.0) (10.0 (1.0) (49.0) (64.0) (11.0) (16.0) A 33 Interest Expense 34 Interest and Invest. Income 35 Net Interest Exp. 36 37 Currency Exchange Gains (Loss) 38 Other Non-Operating Inc. (Exp.) 39 EBT Excl. Unusual Items . 40 41 Restructuring Charges 42 Merger & Related Restruct. Charges 43 Impairment of Goodwill 44 Gain (Loss) On Sale Of Invest 45 Gain (Loss) On Sale Of Assets 46 Asset Writedown 47 Legal Settlements 48 Other Unusual Items 49 EBT Incl. Unusual Items 50 51 Income Tax Expense 52 Earnings from Cont. Ops. 53 54 Earnings of Discontinued Ops. 55 Extraord. Item & Account Change 56 Net Income to Company 57 58 Minority Int. in Earnings 59 Net Income 60 61 62 (54.0) (22.0) 1,316.0 830.0 625.0 766.0 1,336.0 392.0 924.0 106.0 724.0 151.0 474.0 174.0 592.0 328.0 1,008.0 (37.0) (463.0) (263.0) 1,036.0 (6.0) 887.0 261.0 211.0 1,628.0 1,002.0 887.0 261.0 211.0 1.628,0 1.002.0 Income Statement Balance Sheet Cash Flow | + + 100% Type here to search o O E d d)) 8:19 PM 10/23/2021 H Student Campbell Soup Company NYSE CPB Financials - Compatibility Mode - Excel Search Mohamed, Sami MS File Home Insert Page Layout Formulas Data Review View Help Acrobat Share Comments Insert Verdana LG 8 8 - A ab == a Wrap Text General AY o 3 9X Delete WS Paste BIU A y Ideas $ %) 4800 - 3 Merge & Center y Sensitivity Format Conditional Format as Cell Formatting Table Styles Styles Sort & Find & Filter Select Editing Clipboard Font Alignment Number Cells Ideas Sensitivity E13 X fic A B C D F F G H J K L M M 3 4 5 Campbell Soup Company (NYSE:CPB) > Financials > Balance Sheet Template: Period Type: Currency: Units: Standard Annual Reported Currency S&P Capital IQ (Defau Restatement: Order: Conversion: Decimals: Latest Filings Latest on Right Historical Capital IQ (Default) Jul-30-2017 USD Reclassified Jul-29-2018 USD Jul-28-2019 USD Aug-02-2020 USD Aug-01-2021 USD 319.0 319.0 49.0 49.0 31.0 31.0 859.0 859.0 69.0 69.0 6 7 In Millions of the reported currency, except per share items. 8 9 10 11 12 13 Balance Sheet Balance Sheet as of: 14 15 Currency 16 ASSETS 17 Cash And Equivalents 18 Total Cash & ST Investments 19 20 Accounts Receivable 21 Other Receivables 22 Total Receivables 23 24 Inventory 25 Other Current Assets 26 Total Current Assets 27 28 Gross Property, Plant & Equipment 29 Accumulated Depreciation 30 Net Property, Plant & Equipment 31 | Income Statement Balance Sheet 550.0 55.0 605.0 510.0 53.0 563.0 525.0 49.0 574.0 530.0 45.0 575.0 544.0 51.0 595.0 902.0 74.0 1,900.0 887.0 797.0 2,296.0 863.0 499.0 1,967.0 871.0 80.0 2,385.0 933.0 98.0 1,695.0 6,043.0 (3,589.0) 2,454.0 5,239.0 (2,773.0) 2,466.0 5,215,0 (2,760.0) 2,455.0 5,539,0 (2,917.0) 2,622.0 5,724.0 (3,119.0) 2,605.0 Cash Flow + + 100% 1 Type here to search o . tij d 8:19 PM la 4) 10/23/2021 H Student Campbell Soup Company NYSE CPB Financials - Compatibility Mode - Excel Search Mohamed, Sami MS File Home Insert Page Layout Formulas Data Review View Help Acrobat Share Comments Verdana Insert 8 8 - A ab == General HI AY O 3 Wrap Text 3 Merge & Center 9X Delete Paste BIU Ideas MA y Sensitivity $ % y .00 Format Conditional Format as Cell Formatting Table Styles Styles Sort & Find & Filter Select Editing Clipboard Font Alignment Number Cells Ideas Sensitivity E13 X fic B D E F F G H 1 J K L M C 92.0 3,864.0 3,664.0 2.0 2,145.0 14.529.0 77.0 4,017.0 3,415.0 3,986.0 3,350.0 69.0 2,115.0 1,118.0 36.0 34.0 7.726,0 3,981.0 3,239.0 1,217.0 13.148.0 29.0 12.372.0 214.0 11.734.0 705.0 494.0 1,135.0 390.0 1,070.0 513.0 37.0 . 32 Long-term Investments 33 Goodwill 34 Other Intangibles 35 Deferred Tax Assets, LT 36 Other Long-Term Assets 37 Total Assets 38 39 LIABILITIES 40 Accounts Payable 41 Accrued Exp. . 42 Short-term Borrowings 43 Curr. Port of LT Debt 44 Curr. Port. of Leases 45 Curr. Income Taxes Payable 46 Other Current Liabilities 47 Total Current Liabilities 48 49 Long-Term Debt 50 Long-Term Leases 51 Pension & Other Post-Retire. Benefits 52 Def. Tax Liability, Non-Curr. 53 Other Non-Current Liabilities 54 Total Liabilities 55 56 Common Stock 57 Additional Paid In Capital 58 Retained Earnings 59 Treasury Stock 60 Comprehensive Inc. and Other 61 Total Common Equity | Income Statement 666.0 494.0 1,036.0 22.0 1.0 20.0 156.0 2,395.0 814.0 572.0 850.0 500.0 21.0 15.0 613.0 3,385.0 1,049.0 603.0 278.0 921.0 70.0 24.0 130.0 3,075.0 65.0 5.0 124.0 10.0 860.0 3,594.0 1,814.0 7,991.0 2,492.0 7.0 508.0 490.0 189.0 6,081.0 347.0 960.0 264.0 13,156.0 7,101.0 2.0 389.0 924.0 235.0 12.036.0 4,990.0 188.0 462.0 914.0 174.0 9,803.0 5,002.0 188.0 341.0 1,051.0 184.0 8,580.0 12.0 359.0 2,385.0 (1,066.0) (53.0) ) 1,637.0 12.0 349.0 2,224.0 (1,103.0) (118.0) 1,364.0 12.0 372.0 1,993.0 (1,076.0) (1980) 1,103.0 12.0 394.0 3,190.0 (1,023.0) (10.0) 2,563.0 12.0 414.0 3,742.0 (1,021.0) 5.0 3,152.0 Balance Sheet Cash Flow + + 100% Type here to search o o Pi d d)) 8:19 PM 10/23/2021 H Student Campbell Soup Company NYSE CPB Financials - Compatibility Mode - Excel Search Mohamed, Sami MS File Home Insert Page Layout Formulas Data Review View Help Acrobat Share Comments X Insert Verdana 8 8 - A ab == General AY O 3 Wrap Text 3 Merge & Center 9X Delete Paste BIU Ideas MA y Sensitivity $ % y Format Conditional Format as Cell Formatting Table Styles Styles Sort & Find & Filter Select Editing Clipboard Font Alignment Number Cells Ideas Sensitivity E13 X fic B E F G H 1 J K L M 508.0 490.0 189.0 6,081.0 C 347.0 960.0 264.0 13,156.0 D 389.0 924.0 235.0 12,036.0 462.0 914.0 174.0 9,803.0 341.0 1,051.0 184.0 8,580.0 12.0 359.0 2,385.0 (1,066.0) (53.0) 1,637.0 12.0 349.0 2,224.0 (1,103.0) (118.0) 1,364.0 12.0 372.0 1,993.0 (1,076.0) (1980) 1,103.0 12.0 394.0 3.190.0 (1,023.0) (10.0) 2,563.0 12.0 414.0 3,742.0 (1,021.0) 5.0 3,152.0 8.0 9.0 9.0 6.0 2.0 A 51 Pension & Other Post-Retire. Benefits 52 Def. Tax Liability, Non-Curr. 53 Other Non-Current Liabilities 54 Total Liabilities 55 56 Common Stock 57 Additional Paid In Capital 58 Retained Earnings 59 Treasury Stock 60 Comprehensive Inc. and Other 61 Total Common Equity 62 63 Minority interest 64 65 Total Equity 66 67 Total Liabilities And Equity 68 69 Supplemental Items 70 Total Shares Out. on Balance Sheet Date 71 72 73 74 75 76 77 78 79 80 1,645.0 1,373.0 1.112.0 2,569.0 3,154.0 7.726,0 14.529.0 13.148.0 12.372.0 11.734.0 301.0 301.0 301.0 302.0 302.0 Income Statement Balance Sheet Cash Flow | # + 100% Type here to search j o tij d d)) 8:19 PM 10/23/2021 Student Campbell Soup Company NYSE CPB Financials - Compatibility Mode - Excel Search Mohamed, Sami MS File Home Insert Page Layout Formulas Data Review View Help Acrobat Share Comments X Insert Arial 8 8 - A ab == a Wrap Text General AY O 3 9X Delete Paste BIU A Ideas y 3 Merge & Center y Sensitivity $ % -29 .00 Format Conditional Format as Cell Formatting Table Styles Styles Sort & Find & Filter Select Editing Clipboard Font Alignment Number Cells Ideas Sensitivity H7 X for . A B B D E F G H 1 J K L M M 4 5 Campbell Soup Company (NYSE:CPB) > Financials > Cash Flow 6 7 In Millions of the reported currency, except per share items. 8 9 10 11 12 13 Cash Flow Template: Period Type: Currency: Units: Standard Annual Reported Currency S&P Capital IQ (Defau Restatement: Order: Conversion: : Decimals: Latest Filings Latest on Right Historical Capital IQ (Default) Restated 12 months Jul-30-2017 USD Restated 12 months Jul-29-2018 USD Restated 12 months Jul-28-2019 USD Restated 12 months Aug-02-2020 USD 12 months Aug-01-2021 USD 887.0 192.0 1.0 193.0 261.0 259.0 20.0 279.0 211.0 315.0 48.0 363.0 1,628.0 285.0 43.0 328.0 1,002.0 275.0 42.0 317.0 - 11.0 For the Fiscal Period Ending 14 15 Currency 16 17 Net Income 18 Depreciation & Amort. 19 Amort. of Goodwill and Intangibles 20 Depreciation & Amort., Total 21 22 (Gain) Loss From Sale Of Assets 23 (Gain) Loss On Sale Of Invest. 24 Asset Writedown & Restructuring Costs 25 Stock-Based Compensation 26 Net Cash From Discontinued Ops 27 Other Operating Activities 28 Change in Acc. Receivable 29 Change In Inventories 30 Change in Acc. Payable 31 Change in Other Net Operating Assets Income Statement (975.0) 49.0 9.0 61.0 21.0 64.0 18.0 60.0 285.0 (206.0) 28.0 46.0 (48.0) (27.0) Cash Flow 10.0 116.0 61.0 914.0 (308.0) 56.0 (84.0) 78.0 27.0 32.0 1.0 47.0 58.0 312.0 77.0 (11.0) 36.0 125.0 (1.0) 204.0 (30.0) (20.0) 145.0 (3.0) (91.0) (20.0) (77.0) (164.0) (28.0) Balance Sheet + + 100% Type here to search gi . d . d)) 8:20 PM 10/23/2021 C Student Campbell Soup Company NYSE CPB Financials - Compatibility Mode - Excel Search Mohamed, Sami MS File Home Insert Page Layout Formulas Data Review View Help Acrobat Share Comments X Insert Arial 8 8 - A == ab Wrap Text General HI 3 AY O 9X Delete WES Paste BIU A Ideas y 3 Merge & Center y Sensitivity $ % .00 Format Conditional Format as Cell Formatting Table Styles Styles Sort & Find & Filter Select Editing Clipboard Font Alignment Number Cells Ideas Sensitivity H7 X fic B C D F F G H 1 J K L M 1,236.0 1,410.0 1,250.0 1,396.0 1,035.0 (338.0) (407.0) (6,781.0) 10.0 (384.0) (47.0) 31.0 (299.0) (11.0) 2,548.0 30.0 (275.0) (2.0) 111.0 (30.0) (368.0) (19.0) (7,197.0) 553.0 153.0 4.0 2,272.0 8.0 (158.0) 5,839.0 320.0 . 32 Cash from Ops. 33 34 Capital Expenditure 35 Cash Acquisitions 36 Divestitures 37 Invest. in Marketable & Equity Securt. 38 Net (Inc.) Dec. in Loans Originated/Sold 39 Other Investing Activities 40 Cash from Investing 41 42 Short Term Debt Issued 43 Long-Term Debt Issued 44 Total Debt Issued 45 Short Term Debt Repaid 46 Long-Term Debt Repaid 47 Total Debt Repaid 48 49 Issuance of Common Stock 50 Repurchase of Common Stock 51 52 Common Dividends Paid 53 Total Dividends Paid 54 55 Special Dividend Paid 56 Other Financing Activities 57 Cash from Financing 58 59 Foreign Exchange Rate Adj. 60 Net Change in Cash 61 8,247.0 211.0 8,458.0 (8,002.0) (490.0) (8,492.0) 10,222.0 6,224.0 16,446.0 (9,944.0) (63.0) (10,007.0) 5,839.0 (6,296.0) (702.0) (6,998.0) 5,617,0 1,000.0 6,617.0 (6,909.0) (2,268.0) (9,177.0) 320.0 (580.0) (921.0) (1,501.0) 2.0 (459.0) 2.0 (51.0) (109.0) 23.0 (12.0) (8.0) (420.0) (420.0) (426.0) (426.0) (423.0) (423.0) (426.0 (426.0) (439.0) (439.0) 3.0 (908.0) (97.0) 5,807.0 (1.0) (1,591.0) (12.0) (2,987.0) (1,669.0) 2.0 11.0 129.0) (8.0) 12.0 (7.0) (1950) (1.0) 680.0 1790.0) | Income Statement Balance Sheet Cash Flow + + 100% Type here to search o o . tij d d)) 8:20 PM 10/23/2021


