Question
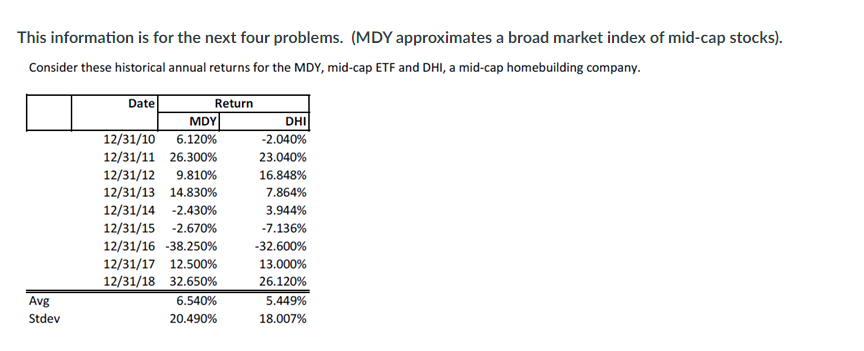
1. What is closest to the correlation coef. between these two? (Hint: Use Excel's correl function). C) 100% E) 75% A) -11% D) 96% B)

1. What is closest to the correlation coef. between these two? (Hint: Use Excel's "correl" function).
C) 100%
E) 75%
A) -11%
D) 96%
B) 0%
2. Assume that MDY represents the market of mid-cap stocks and you are a mid-cap-stock-only investor. Which is closest to DHI's beta? (Hint: use your answer to the previous question with the formula given in HO13b).
E) 0.75
A) (0.50)
D) 0.85
B) 0.00
C) 1.00
3. Historically, has DHI been more or less volatile than the mid-cap stock market, if the stock market is approximated by MDY?
B) Less volatile
A) More volatile
4. For the purpose of this question (irrespective of your prior answers) assume DHI is less volatile than the mid-cap market, but positively correlated to it. What best explains this?
A)DHI's beta (computed relative to MDY) is negative, and its standard deviation is less than MDY's.
B)DHI's beta (computed relative to MDY) is positive and greater than 1, and its standard deviation is less than MDY's.
C)DHI's beta (computed relative to MDY) is positive but less than 1, and its standard deviation is less than MDY's.
D)DHI's beta (computed relative to MDY) is positive and greater than 1, and its standard deviation is greater than MDY's.
E)DHI works in a staid, steady-state industry, and should therefore should be expected to be less volatile than the entire mid-cap market.
This information is for the next four problems. (MDY approximates a broad market index of mid-cap stocks). Consider these historical annual returns for the MDY, mid-cap ETF and DHI, a mid-cap homebuilding company. DHI Date Return MDY 12/31/10 6.120% -2.040% 12/31/11 26.300% 23.040% 12/31/12 9.810% 16.848% 12/31/13 14.830% 7.864% 12/31/14 -2.430% 3.944% 12/31/15 -2.670% -7.136% 12/31/16 -38.250% -32.600% 12/31/17 12.500% 13.000% 12/31/18 32.650% 26.120% 6.540% 5.449% 20.490% 18.007% Avg Stdev This information is for the next four problems. (MDY approximates a broad market index of mid-cap stocks). Consider these historical annual returns for the MDY, mid-cap ETF and DHI, a mid-cap homebuilding company. DHI Date Return MDY 12/31/10 6.120% -2.040% 12/31/11 26.300% 23.040% 12/31/12 9.810% 16.848% 12/31/13 14.830% 7.864% 12/31/14 -2.430% 3.944% 12/31/15 -2.670% -7.136% 12/31/16 -38.250% -32.600% 12/31/17 12.500% 13.000% 12/31/18 32.650% 26.120% 6.540% 5.449% 20.490% 18.007% Avg StdevStep by Step Solution
There are 3 Steps involved in it
Step: 1

Get Instant Access to Expert-Tailored Solutions
See step-by-step solutions with expert insights and AI powered tools for academic success
Step: 2

Step: 3

Ace Your Homework with AI
Get the answers you need in no time with our AI-driven, step-by-step assistance
Get Started


