

Question
1 . What is consumer surplus? a)A condition that requires the cost of goods to be higher than in other countries. b)The difference between what
1 . What is consumer surplus?
a)A condition that requires the cost of goods to be higher than in other countries.
b)The difference between what a consumer pays for a good and how much they would have been willing to pay for it.
c)The total value of all goods that a consumer purchases within a given timeframe.
2 . What is market equilibrium?
a)A situation where the quantity demanded is equal to the quantity supplied given a specific price.
b)A market in which suppliers are price-takers, resulting in perfect competition and no profits.
c)A combination of inputs that result in the most efficient production and the lowest-possible prices.
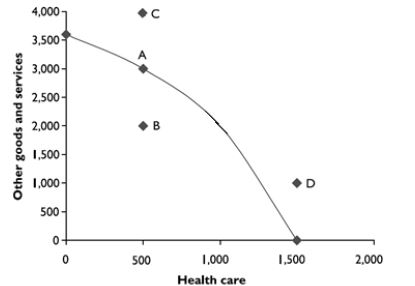
3 .The following is the production possibilities frontier of an economy, describing combinations of healthcare and other goods produced. Which of the points is/are technically infeasible?
a)A
b)B
c)C
d)D
4.What is the link between efficient production and the production possibilities frontier?
a)The production possibilities frontier shows the various combinations of goods that are feasible to be produced efficiently.
b)Efficiency makes the production possibilities frontier irrelevant.
c)Inefficient or infeasible combinations of outputs do not lie on the production possibilities frontier.
5.What is the law of diminishing marginal utility?
a)An economic condition that dictates that every good a consumer buys must have lower value than the previous good they bought.
b)A hypothesis that suggests that with each additional unit of a good consumed, its extra benefit gained decreases.
c)The sub-optimal satisfaction consumers get from consumption of high-cost goods.
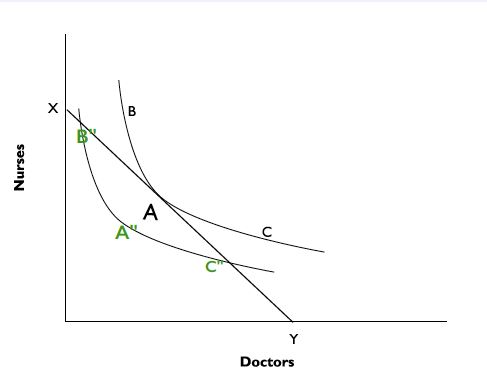
1.In the graph below, nurses and doctors are "inputs." The graph serves to illustrate the concepts of isocosts and isoquants. Curve R1 includes points A, B, and C. Curve R2 includes points A", B", and C". refer to short ans 1 photo.
a)At which point on the graph is efficiency of production achieved?
b)Why might other combinations be inefficient?
c)What do points A", B", and C" illustrate?
d)What is the term for the straight line (beginning at point X on the vertical axis and ending at point Y on the horizontal axis)? What does it represent in this graph?
2.List two characteristics of perfectly competitive markets.
3.List two reasons why health care is not a perfectly competitive good
4.(a) List two factors that can make demand for a good or service more price elastic.
(b) List one example for each factor.
5.Briefly describe two (2) reasons why markets can be a useful resource allocation mechanism in the context of health services or product.
1.The price of Advil increases from $20 per 200 mg to $24 per 200 mg. As a result, the quantity demanded decreases from 17 million units to 15 million units.
a)Calculate the price elasticity of demand for Advil using the mid-point method. Assume that the decline in Advil sales is solely attributed to the price change (i.e., no other factors contributed to the decline in sales except for the price change)
b)Is the price of Advil elastic or inelastic? Why?
c)List and explain two factors that may determine whether Advil is price elastic or price inelastic.
2.The fixed cost of manufacturing antibiotics includes factory and machine investments that total $500,000 per year. The variable costs amount to $5 per package produced.
a)What is the total cost of producing 10,000 packages per year?
b)What is the average total cost of producing 20,000 packages per year?
c)What is the average fixed cost of producing 50,000 packages per year?
ShortQ
a)Briefly list and describe two determinants of supply. Choose any good from any economic sector (can be healthcare or any other industry) and describe how each of the two determinants of supply you listed can increase or decrease the supply for the good.
b)For each of the determinants of supply you listed for part (a) describe how it would affect the supply curve in a graph. (Hint: think about whether this determinant would either cause a move along the supply curve or if it would shift the supply curve, then describe how this would be illustrated on a graph)
Step by Step Solution
There are 3 Steps involved in it
Step: 1

Get Instant Access to Expert-Tailored Solutions
See step-by-step solutions with expert insights and AI powered tools for academic success
Step: 2

Step: 3
Ace Your Homework with AI
Get the answers you need in no time with our AI-driven, step-by-step assistance
Get Started
Strategic Management And Business Policy Toward Global Sustainability
Authors: Thomas L. Wheelen, J. David Hunger
13th Edition
9780132998079, 132998076, 978-0132153225