


1. What is ratio 1? 2. What is ratio 3? 3. What is ratio 6? 4. What is ratio 4? (at least two decimal points)
1. What is ratio 1?
2. What is ratio 3?
3. What is ratio 6?
4. What is ratio 4? (at least two decimal points)
5. What is ratio 7?
6. What is ratio 12?
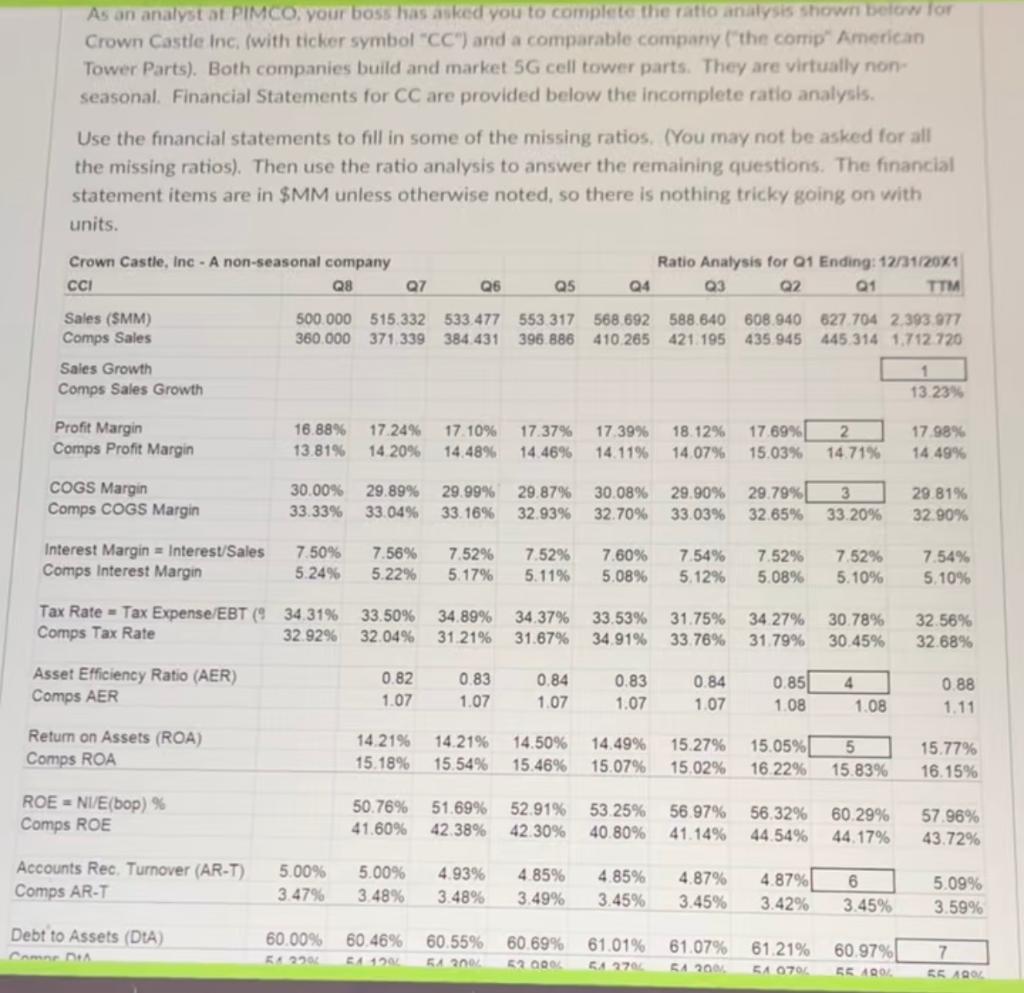
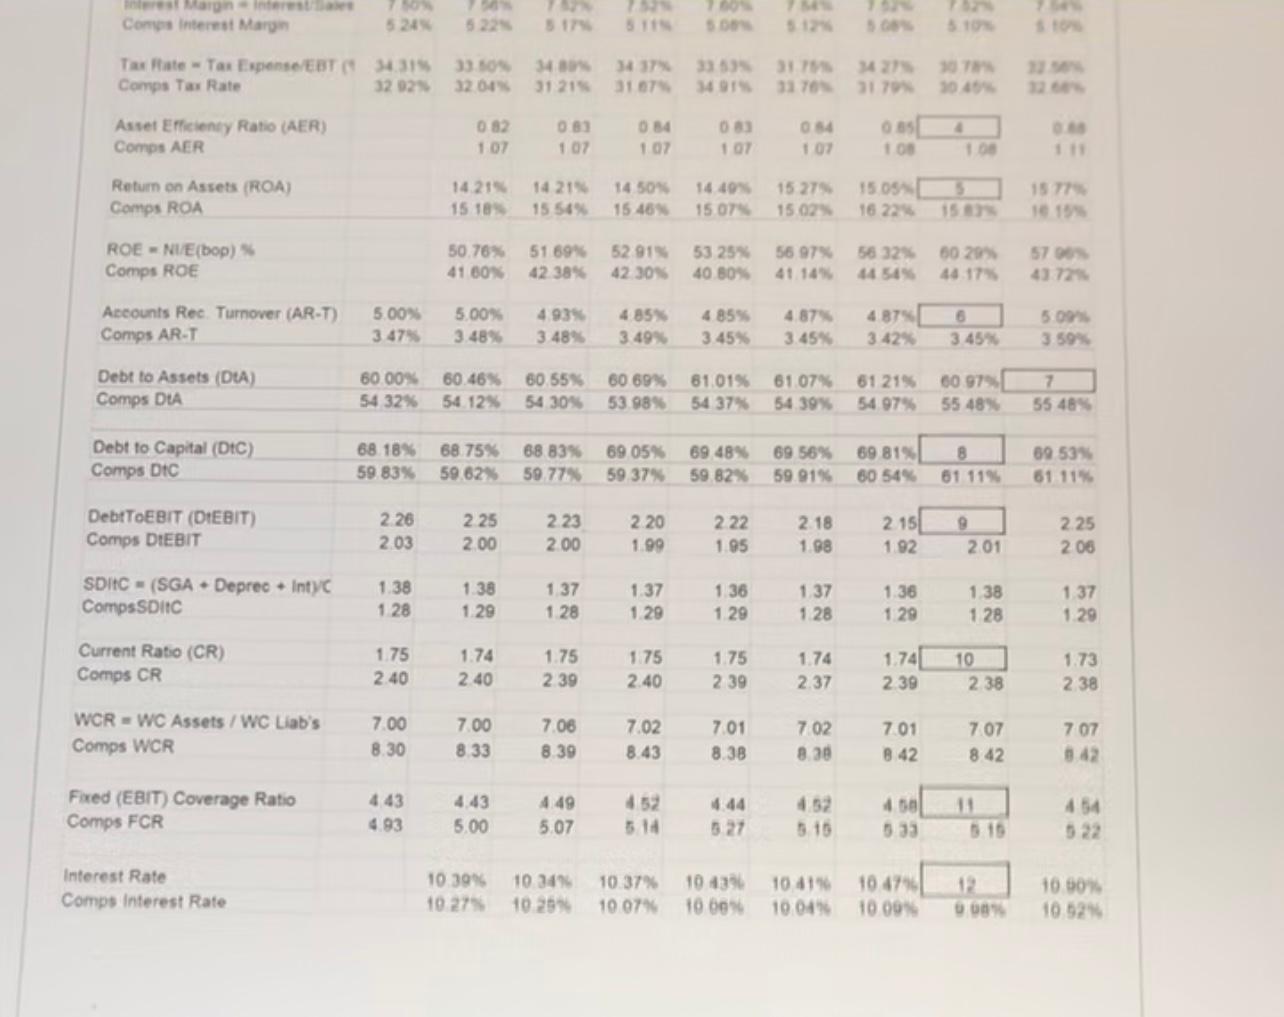
As an analyst at PIMCO, your boss has asked you to complete the ratio analysis shown below for Crown Castle Inc. (with ticker symbol "CC") and a comparable company ("the comp" American Tower Parts). Both companies build and market 5G cell tower parts. They are virtually non- seasonal Financial Statements for CC are provided below the incomplete ratio analysis. Use the financial statements to fill in some of the missing ratios. (You may not be asked for all the missing ratios). Then use the ratio analysis to answer the remaining questions. The financial statement items are in $MM unless otherwise noted, so there is nothing tricky going on with units. Crown Castle, Inc - A non-seasonal company CCI Q8 Ratio Analysis for Q1 Ending: 12/31/20X1 04 Q3 Q2 01 TTM Q7 Q6 Q5 Sales (SMM) Comps Sales Sales Growth Comps Sales Growth 500.000 515.332 533.477 553 317 568 692 588 640 608.940 627 704 2.393 977 360.000 371 339 384.431 396 886 410 265 421 195 435 945 445 314 1.712 720 1 13.23% Profit Margin Comps Profit Margin 16.88% 13.81% 17.24% 14 20% 17 10% 14.48% 17.37% 14.4696 17.39% 14.11% 18.12% 14.07% 17.69% 15.03% 2 14 71% 17 98% 14 49% COGS Margin Comps COGS Margin 30.00% 29.89% 33.33% 33.04% 29.99% 33.16% 29.8796 32.93% 30.08% 32.70% 29.90% 29.79%[ 33.03% 32.65% 3 33.20% 29 81% 32.90% Interest Margin = Interest/Sales Comps Interest Margin 7.50% 5.24% 7.56% 5.22% 7.5296 5.17% 7.52% 5.11% 7.60% 5.08% 7.54% 5.12% 7.52% 5.08% 7.52% 5.10% 7.54% 5.10% Tax Rate = Tax Expense/EBT ( 34.31% Comps Tax Rate 32 92% 33.50% 32.04% 34.89% 31 21% 34.37% 31.67% 33.53% 34.91% 31.75% 33.76% 34 27% 31.79% 30.78% 30.45% 32.56% 32.68% Asset Efficiency Ratio (AER) Comps AER 0.82 1.07 0.83 1.07 0.84 1.07 0.83 1.07 0.84 1.07 0.85| 1.08 4 1.08 0.88 1.11 Return on Assets (ROA) Comps ROA 14.21% 15.18% 14.21% 15.54% 14.50% 15.46% 14.49% 15.07% 15.27% 15.02% 15.05% 16.22% 5 15.83% 15.77% 16.15% ROE = N1/E(bop) % Comps ROE 50.76% 41.60% 51.69% 42.38% 52.91% 42 30% 53.25% 40.80% 56.97% 41.14% 56.32% 44.54% 60.29% 44.17% 57.96% 43.72% Accounts Rec. Turnover (AR-T) Comps AR-T 5.00% 3.47% 5.00% 3.48% 4.93% 3.48% 4.85% 3.49% 4 85% 3.45% 4.87% 3.45% 6 4.87% 3.42% 5.09% 3.59% 3.45% Debt to Assets (DIA) CARA DA 60.00% 5+22 60.46% 129 60.55% 54200 60.69% 57 000 61.01% 54 270 61.07% SA 2001 61.21% 54 0704 60.97% 56 400 7 55 AO restarteren Comps Interest Mary 5224 17 17 5. Tarate Tax Expense/EBT 34.3153.09 340 343793357 Comps Tax Rate 32 32 32 04 31 215 31 421 31 TO 317 3045 Asset Efficienty Ratio (AER) Comps AER 082 1 07 0.83 1 07 084 1 07 033 107 65 107 10 10 Return on Assets (ROA) Comps ROA 14.21% 15 18% 1421 15 54% 14 50% 15 46% 14.49 15 075 15 279 15.05 15 02 16 224 1577 15 ROENVE(bop) Comps ROE 50.76% 41 60% 56 32 57 51 699 42 38% 52.91% 53 25 42 30% 40 80% 56 979 41 14 50 29 48.17 Accounts Rec. Turnover (AR-T) Comps ART 5.00% 3.47% 5.00% 3.48% 4.93 3.48% 4.85% 3.49% 4 85% 3.45% 4.87% 3.45% 487 3.42% 5.09 3.59% 3.45% Debt to Assets (DIA) Comps DIA 60.00% 54 32% 60.46% 54.12% 60.55% 54 30% 60 69% 53 989 81.01% 54 37% 61.07% 54 39% 61 215 54 97% 60 97 55 48% 7 55 484 Debt to Capital (DC) Comps DTC 68.18% 59 83% 68.75% 68 83% 59.62% 59 77% 69 05% 59 37% 69 48% 69 56% 59 82% 59.91% 69 81% 60 54% 8 61 119 69 53 61 11% DebtToEBIT (DEBIT) Comps DEBIT 2.26 203 2 25 2.00 2.23 200 2.20 1.99 2.22 1.95 2.18 1.98 2.15 1.92 9 201 2.25 2 06 SDIC - (SGA - Deprec. Inty Comps SDIC 1.38 1 28 1.38 1.29 1.37 1 28 1.37 1.29 1 36 1 29 1 37 1 28 1.36 1.29 1 38 1 28 1 37 1.29 Current Ratio (CR) Comps CR 1.75 2.40 1.74 2.40 1.75 2.39 1.75 2.40 1.75 2 39 1.74 2.37 1.741 239 10 2 38 1.73 2.38 WCR - WC Assets / WC Lab's Comps WCR 7.00 8.30 7.00 8.33 7.06 8.39 7.02 8.43 7.01 8.38 702 8.38 7.01 8.42 707 8.42 707 3.42 Fixed (EBIT) Coverage Ratio Comps FCR 4.43 4.93 4.43 5.00 4.49 5.07 452 5.14 4.54 4.50 533 11 5.15 3.27 5.15 Interest Rate Comps Interest Rate 10.39% 10.27 10.34% 10 29 12 10.37% 10.07% 10 435 100% 10.41 10.04 10.4716 10 00 10 60 10.52 As an analyst at PIMCO, your boss has asked you to complete the ratio analysis shown below for Crown Castle Inc. (with ticker symbol "CC") and a comparable company ("the comp" American Tower Parts). Both companies build and market 5G cell tower parts. They are virtually non- seasonal Financial Statements for CC are provided below the incomplete ratio analysis. Use the financial statements to fill in some of the missing ratios. (You may not be asked for all the missing ratios). Then use the ratio analysis to answer the remaining questions. The financial statement items are in $MM unless otherwise noted, so there is nothing tricky going on with units. Crown Castle, Inc - A non-seasonal company CCI Q8 Ratio Analysis for Q1 Ending: 12/31/20X1 04 Q3 Q2 01 TTM Q7 Q6 Q5 Sales (SMM) Comps Sales Sales Growth Comps Sales Growth 500.000 515.332 533.477 553 317 568 692 588 640 608.940 627 704 2.393 977 360.000 371 339 384.431 396 886 410 265 421 195 435 945 445 314 1.712 720 1 13.23% Profit Margin Comps Profit Margin 16.88% 13.81% 17.24% 14 20% 17 10% 14.48% 17.37% 14.4696 17.39% 14.11% 18.12% 14.07% 17.69% 15.03% 2 14 71% 17 98% 14 49% COGS Margin Comps COGS Margin 30.00% 29.89% 33.33% 33.04% 29.99% 33.16% 29.8796 32.93% 30.08% 32.70% 29.90% 29.79%[ 33.03% 32.65% 3 33.20% 29 81% 32.90% Interest Margin = Interest/Sales Comps Interest Margin 7.50% 5.24% 7.56% 5.22% 7.5296 5.17% 7.52% 5.11% 7.60% 5.08% 7.54% 5.12% 7.52% 5.08% 7.52% 5.10% 7.54% 5.10% Tax Rate = Tax Expense/EBT ( 34.31% Comps Tax Rate 32 92% 33.50% 32.04% 34.89% 31 21% 34.37% 31.67% 33.53% 34.91% 31.75% 33.76% 34 27% 31.79% 30.78% 30.45% 32.56% 32.68% Asset Efficiency Ratio (AER) Comps AER 0.82 1.07 0.83 1.07 0.84 1.07 0.83 1.07 0.84 1.07 0.85| 1.08 4 1.08 0.88 1.11 Return on Assets (ROA) Comps ROA 14.21% 15.18% 14.21% 15.54% 14.50% 15.46% 14.49% 15.07% 15.27% 15.02% 15.05% 16.22% 5 15.83% 15.77% 16.15% ROE = N1/E(bop) % Comps ROE 50.76% 41.60% 51.69% 42.38% 52.91% 42 30% 53.25% 40.80% 56.97% 41.14% 56.32% 44.54% 60.29% 44.17% 57.96% 43.72% Accounts Rec. Turnover (AR-T) Comps AR-T 5.00% 3.47% 5.00% 3.48% 4.93% 3.48% 4.85% 3.49% 4 85% 3.45% 4.87% 3.45% 6 4.87% 3.42% 5.09% 3.59% 3.45% Debt to Assets (DIA) CARA DA 60.00% 5+22 60.46% 129 60.55% 54200 60.69% 57 000 61.01% 54 270 61.07% SA 2001 61.21% 54 0704 60.97% 56 400 7 55 AO restarteren Comps Interest Mary 5224 17 17 5. Tarate Tax Expense/EBT 34.3153.09 340 343793357 Comps Tax Rate 32 32 32 04 31 215 31 421 31 TO 317 3045 Asset Efficienty Ratio (AER) Comps AER 082 1 07 0.83 1 07 084 1 07 033 107 65 107 10 10 Return on Assets (ROA) Comps ROA 14.21% 15 18% 1421 15 54% 14 50% 15 46% 14.49 15 075 15 279 15.05 15 02 16 224 1577 15 ROENVE(bop) Comps ROE 50.76% 41 60% 56 32 57 51 699 42 38% 52.91% 53 25 42 30% 40 80% 56 979 41 14 50 29 48.17 Accounts Rec. Turnover (AR-T) Comps ART 5.00% 3.47% 5.00% 3.48% 4.93 3.48% 4.85% 3.49% 4 85% 3.45% 4.87% 3.45% 487 3.42% 5.09 3.59% 3.45% Debt to Assets (DIA) Comps DIA 60.00% 54 32% 60.46% 54.12% 60.55% 54 30% 60 69% 53 989 81.01% 54 37% 61.07% 54 39% 61 215 54 97% 60 97 55 48% 7 55 484 Debt to Capital (DC) Comps DTC 68.18% 59 83% 68.75% 68 83% 59.62% 59 77% 69 05% 59 37% 69 48% 69 56% 59 82% 59.91% 69 81% 60 54% 8 61 119 69 53 61 11% DebtToEBIT (DEBIT) Comps DEBIT 2.26 203 2 25 2.00 2.23 200 2.20 1.99 2.22 1.95 2.18 1.98 2.15 1.92 9 201 2.25 2 06 SDIC - (SGA - Deprec. Inty Comps SDIC 1.38 1 28 1.38 1.29 1.37 1 28 1.37 1.29 1 36 1 29 1 37 1 28 1.36 1.29 1 38 1 28 1 37 1.29 Current Ratio (CR) Comps CR 1.75 2.40 1.74 2.40 1.75 2.39 1.75 2.40 1.75 2 39 1.74 2.37 1.741 239 10 2 38 1.73 2.38 WCR - WC Assets / WC Lab's Comps WCR 7.00 8.30 7.00 8.33 7.06 8.39 7.02 8.43 7.01 8.38 702 8.38 7.01 8.42 707 8.42 707 3.42 Fixed (EBIT) Coverage Ratio Comps FCR 4.43 4.93 4.43 5.00 4.49 5.07 452 5.14 4.54 4.50 533 11 5.15 3.27 5.15 Interest Rate Comps Interest Rate 10.39% 10.27 10.34% 10 29 12 10.37% 10.07% 10 435 100% 10.41 10.04 10.4716 10 00 10 60 10.52Step by Step Solution
There are 3 Steps involved in it
Step: 1

Get step-by-step solutions from verified subject matter experts
100% Satisfaction Guaranteed-or Get a Refund!
Step: 2Unlock detailed examples and clear explanations to master concepts

Step: 3Unlock to practice, ask and learn with real-world examples
See step-by-step solutions with expert insights and AI powered tools for academic success
-
 Access 30 Million+ textbook solutions.
-
Ask unlimited questions from AI Tutors.
-
Order free textbooks.
-
100% Satisfaction Guaranteed-or Get a Refund!
Claim Your Hoodie Now!
Authors: Steven A. Finkler, Thad Calabrese
4th edition
133060411, 132805669, 9780133060416, 978-0132805667

Study Smart with AI Flashcards
Access a vast library of flashcards, create your own, and experience a game-changing transformation in how you learn and retain knowledge
Explore Flashcards