

Answered step by step
Verified Expert Solution
Question
1 Approved Answer
1. What is Strykers current financial situation. From an Income Statement and Balance Sheet point of view. 2.What are the pros and cons of the
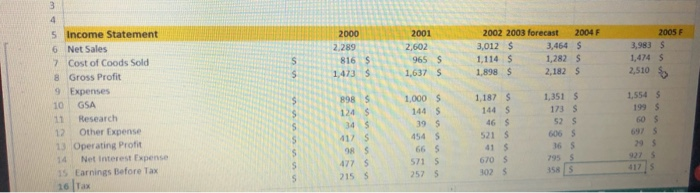
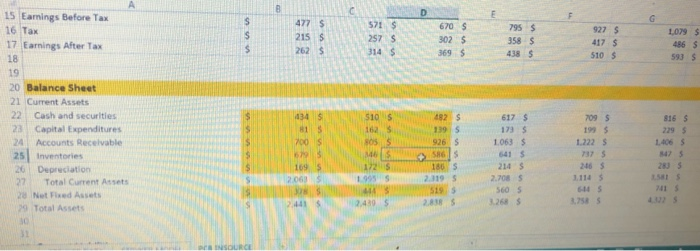
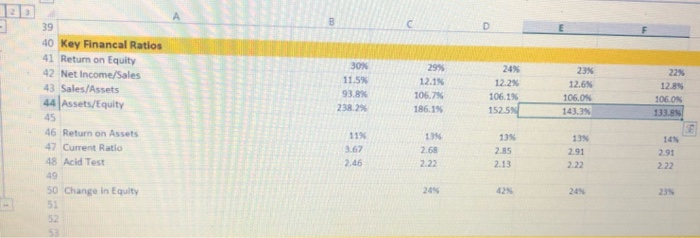 1. What is Strykers current financial situation. From an Income Statement and Balance Sheet point of view. 2.What are the pros and cons of the current plan vs. insourcing the production of PCBs. Provide thought and depth to this answer What are the key financial metrics you would look at to compare the current plan with the insourcing plan? 3. Insourcing will require several financial changes. What are those financial changes? And what are reasonable assumptions as to how much they will change? 4. Assuming it will cost $6 Billion to build a new PCB factory, what are the financials of this plan, and how does it compare with the current outsourcing plan? How does your answer change if that changes to $1B, or $10B? 2000 2001 2,602 965 S 1,637 2002 2003 forecast 2004 F 3,012 $ 3,464 S ,114 $ 1,282 S 1,898 $ 2,182 S 2005 F 3,983 S 1,4745 1 816 S 1.473 $ S 2,510 5 Income Statement 6. Net Sales 7 Cost of Coods Sold 8 Gross Profit 9 Expenses 10 GSA 11 Research 12 Other Expense 13 Operating Profit 14 Net interest Expense 15 Earnings Before Tax 16 Tax 898 $ 120 S 34 1,554 5 1995 60 1,000 $ 140 s. 19 $ 454 S 665 571 S 2575 1,187 $ 144 S 46 5 5215 415 670 S 3025 1,351 5 173 S 52S 6065 36 S 795 5 358 5 927S 15 Eamings Before Tax 16 Tax 17 Earnings After Tax 670S 302 S 927 $ 4175 510 S 1,079 $ 486 590 $ 369 $ 510 S 8165 617 S 1735 1.063 $ 20 Balance Sheet 21 Current Assets 22 Cash and securities 23 Capital Expenditures 24 Accounts Recevable 25 Inventories 26 Depreciation 27 Total Current Atsets 28 Net Fixed Assets 29 Total Assets 25 305S MS 15 905S 2095 1995 1222 737 S 2015 111 5 3,758 S 2005 214 $ 2.7035 5605 2015 2625 30% 40 Key Financal Ratios 41 Return on Equity 42 Net Income/Sales 43 Sales/Assets 44 Assets/Equity 1.5% 12.95 93.89 38.29 12.1% 106.7% 186.1% 24% 12.2% 106.1% 152.5 12.6% 106,0 106. ON 143,3% 13% 46 Return on Assets 47 Current Ratio 48 Acid Test 13% 2.85 7.68 2.91 10 50 Change in Equity 245 243 1. What is Strykers current financial situation. From an Income Statement and Balance Sheet point of view. 2.What are the pros and cons of the current plan vs. insourcing the production of PCBs. Provide thought and depth to this answer What are the key financial metrics you would look at to compare the current plan with the insourcing plan? 3. Insourcing will require several financial changes. What are those financial changes? And what are reasonable assumptions as to how much they will change? 4. Assuming it will cost $6 Billion to build a new PCB factory, what are the financials of this plan, and how does it compare with the current outsourcing plan? How does your answer change if that changes to $1B, or $10B? 2000 2001 2,602 965 S 1,637 2002 2003 forecast 2004 F 3,012 $ 3,464 S ,114 $ 1,282 S 1,898 $ 2,182 S 2005 F 3,983 S 1,4745 1 816 S 1.473 $ S 2,510 5 Income Statement 6. Net Sales 7 Cost of Coods Sold 8 Gross Profit 9 Expenses 10 GSA 11 Research 12 Other Expense 13 Operating Profit 14 Net interest Expense 15 Earnings Before Tax 16 Tax 898 $ 120 S 34 1,554 5 1995 60 1,000 $ 140 s. 19 $ 454 S 665 571 S 2575 1,187 $ 144 S 46 5 5215 415 670 S 3025 1,351 5 173 S 52S 6065 36 S 795 5 358 5 927S 15 Eamings Before Tax 16 Tax 17 Earnings After Tax 670S 302 S 927 $ 4175 510 S 1,079 $ 486 590 $ 369 $ 510 S 8165 617 S 1735 1.063 $ 20 Balance Sheet 21 Current Assets 22 Cash and securities 23 Capital Expenditures 24 Accounts Recevable 25 Inventories 26 Depreciation 27 Total Current Atsets 28 Net Fixed Assets 29 Total Assets 25 305S MS 15 905S 2095 1995 1222 737 S 2015 111 5 3,758 S 2005 214 $ 2.7035 5605 2015 2625 30% 40 Key Financal Ratios 41 Return on Equity 42 Net Income/Sales 43 Sales/Assets 44 Assets/Equity 1.5% 12.95 93.89 38.29 12.1% 106.7% 186.1% 24% 12.2% 106.1% 152.5 12.6% 106,0 106. ON 143,3% 13% 46 Return on Assets 47 Current Ratio 48 Acid Test 13% 2.85 7.68 2.91 10 50 Change in Equity 245 243
Step by Step Solution
There are 3 Steps involved in it
Step: 1

Get Instant Access to Expert-Tailored Solutions
See step-by-step solutions with expert insights and AI powered tools for academic success
Step: 2

Step: 3
Ace Your Homework with AI
Get the answers you need in no time with our AI-driven, step-by-step assistance
Get Started
Securitization The Process Of Homogenizing Financial Instruments Into Fungible Securities So That They Are Sellable On The Securities Market
Authors: Jean B Keating
1st Edition
979-8859072613