

Question
1. What is the cost of debt for Sunrise Bakery? 2. What is their cost of equity? 3. What is the WACC? 4. Which cost
1. What is the cost of debt for Sunrise Bakery?
2. What is their cost of equity?
3. What is the WACC?
4. Which cost of capital should be used to evaluate the feasibility of the oven purchase?
5. Calculate the annual depreciation expense for sunrise capital.
6. What is the after-tax net income in each of the six years?
7. Calculate the change in working capital each year from the projected financial statements.
8. What is the terminal value of the project at the end of year 6?
9. Compute the free cash flows for each year.
10. What is the IRR?
11. Calculate the NPV.
12. Using Payback Analysis, how many years until the project pays off the investment?
13. What is the return on invested capital?
14. Should Sunrise Bakery purchase the new oven?
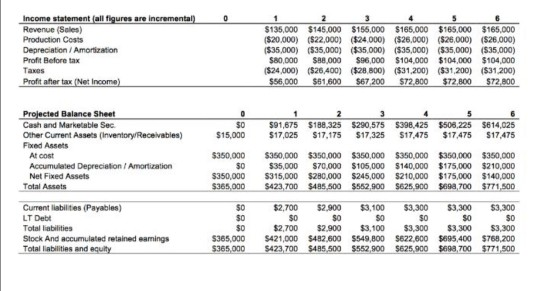
The Sunrise Bakery Corporation was originally founded in Houston, TX in 1991 by Griffin Harris, who currently serves as the company\\\'s Chief Executive Officer. About four years ago, Griffin\\\'s daughter, Erica, moved into the company to serve as Chief Financial Officer. Erica had graduated from college a few years ago and had worked for a few years in retail. However, for the past two years, she had been working quite successfully on an online accounting degree, but she still felt a little uncomfortable in her new role as CFO of the family business. Sunrise produces and markets a variety of bakery products throughout southeast Texas and Louisiana. They operate mostly through warehouse delivery and produce fresh breads, buns, rolls, and snack cakes under a few of their own regional brands but also including some licensed "big name" national brands. In total, they operate five bakeries with one very large facility and four smaller production sites. For the past three years, sales have averaged about $15 Million, generating about $650 Thousand in Net Income per year. However, sales have been roughly flat for the past six years as growth has slowed and production capacity has reached nearly 100%. In order to grow sales, Sunrise Bakery needs to invest in further production capacity Griffin Harris has been looking to purchase more space, build additional bakeries, or even perhaps acquire one of their smaller competitors, but nothing specific has worked out yet. Erica has an alternative short-term plan to modernize the production process at their main plant. Her idea involves the purchase of a new, significantly faster, integrated commercial oven that she recently saw displayed at a trade show. Few other bakeries in the region have invested in this modern equipment, and she expects it may cut costs and improve output efficiency. Her sales representative suggests the new oven could raise incremental sales at their large bakery by 15%. Installation of the oven could be mostly executed over the upcoming Labor-day long weekend and shouldn\\\'t disrupt sales or production too much. However, the new oven requires an expenditure of $350,000, which would be a large capital expenditure for Sunrise. To reflect the wear and tear on the oven, tax law allows for a 10% annual reduction in the value of the oven as a depreciation expense. That is, Erica\\\'s financial forecast includes a non-cash expense of $35,000 for each of the next six years. After six years, Erica\\\'s sales representative expects the oven to be worth about $140,000, which is just equal to the accounting book value of the oven after six years of accumulated depreciation ($140,000 = $350,000 6 10%*S350,000) Operation of the oven also requires a small initial investment in an inventory of spare parts of $15,000. The inventory should be fully recoverable for $15,000 if the machine is sold. The investment in inventory represents an increase in other current assets (inventory) that should be included as a change in working capital requirements for Sunrise Bakery. Sunrise estimates receivables at 1.5% of revenues and payables at 2% of revenues each year. At the end of the project, Erica expects to recover all of the working capital invested in the project. In other words, she expects a cash flow equal to the amount of Non-Cash Current Assets less Current Liabilities in the last year of the project. Erica\\\'s financial forecast for the new oven does not require any significant change in financing. Sunrise started with one small bakery entirely paid for with cash from Griffin Harris and a mortgage on the bakery property. Currently, Sunrise maintains a rough capital structure of about 25% debt and 75%
Please solve this problem Experts it's very urgent Thanks and I will appreciate and tell me ur mail I will appreciate and send u gift
What more information you need?
0 Income statement (all figures are incremental) Revenue (Sales) Production Costs Depreciation / Amortization Profit Before tax Taxes Profit after tax (Net Income) $135,000 $145,000 $155,000 $165.000 $165,000 $165,000 $20.000) ($22,000) ($24.000) ($26.000) ($26.000) ($26,000) ($35,000) ($35,000) ($35,000) ($35,000) ($35,000) ($35,000) $80,000 $88,000 $96,000 $104,000 $104,000 $104,000 $24.000) ($26,400) ($28.800) ($31,200) ($31,200) ($31 200) $56,000 $51.600 $67,200 $72,800 $72,800 572,800 1 $0 $15,000 5 591,675 5188,325 5290,575 5398,425 $508,225 5614,025 $17,025 $17,175 $17,325 $17.475 $17,475 $17.475 Projected Balance Sheet Cash and Marketable Sec Other Current Assets (Inventory/Receivables) Fixed Assets At Cost Accumulated Depreciation / Amortization Net Fixed Assets Total Assets $350,000 $0 $350,000 $365,000 $350,000 $350,000 $350,000 $350,000 $350,000 $350,000 $35,000 $70,000 $105,000 $140,000 $175,000 $210,000 $315,000 $280,000 $245,000 $210,000 $175,000 $140,000 $423,700 $495.500 $552,900 $625 900 $698,700 $771,500 Current liabilities (Payables) LT Debt Total liabilities Stock And accumulated retained earings Total liabilities and equity 50 30 $0 $365,000 $365,000 $2,700 $2.900 $3,100 $3,300 $0 SO SO $0 $2,700 $2,900 $3,100 $3,300 5421,000 $492,600 $549,800 $622,600 $423,700 $485,500 $552,900 $625.900 $3,300 $3,300 $0 $O $3,300 $3,300 $695,400 $768,200 $698,700 $771,500 0 Income statement (all figures are incremental) Revenue (Sales) Production Costs Depreciation / Amortization Profit Before tax Taxes Profit after tax (Net Income) $135,000 $145,000 $155,000 $165.000 $165,000 $165,000 $20.000) ($22,000) ($24.000) ($26.000) ($26.000) ($26,000) ($35,000) ($35,000) ($35,000) ($35,000) ($35,000) ($35,000) $80,000 $88,000 $96,000 $104,000 $104,000 $104,000 $24.000) ($26,400) ($28.800) ($31,200) ($31,200) ($31 200) $56,000 $51.600 $67,200 $72,800 $72,800 572,800 1 $0 $15,000 5 591,675 5188,325 5290,575 5398,425 $508,225 5614,025 $17,025 $17,175 $17,325 $17.475 $17,475 $17.475 Projected Balance Sheet Cash and Marketable Sec Other Current Assets (Inventory/Receivables) Fixed Assets At Cost Accumulated Depreciation / Amortization Net Fixed Assets Total Assets $350,000 $0 $350,000 $365,000 $350,000 $350,000 $350,000 $350,000 $350,000 $350,000 $35,000 $70,000 $105,000 $140,000 $175,000 $210,000 $315,000 $280,000 $245,000 $210,000 $175,000 $140,000 $423,700 $495.500 $552,900 $625 900 $698,700 $771,500 Current liabilities (Payables) LT Debt Total liabilities Stock And accumulated retained earings Total liabilities and equity 50 30 $0 $365,000 $365,000 $2,700 $2.900 $3,100 $3,300 $0 SO SO $0 $2,700 $2,900 $3,100 $3,300 5421,000 $492,600 $549,800 $622,600 $423,700 $485,500 $552,900 $625.900 $3,300 $3,300 $0 $O $3,300 $3,300 $695,400 $768,200 $698,700 $771,500Step by Step Solution
There are 3 Steps involved in it
Step: 1

Get Instant Access to Expert-Tailored Solutions
See step-by-step solutions with expert insights and AI powered tools for academic success
Step: 2

Step: 3
Ace Your Homework with AI
Get the answers you need in no time with our AI-driven, step-by-step assistance
Get Started
Treasury Financial Manual Volume 1 Book 2
Authors: US Treasury
1st Edition
1790318432, 978-1790318438