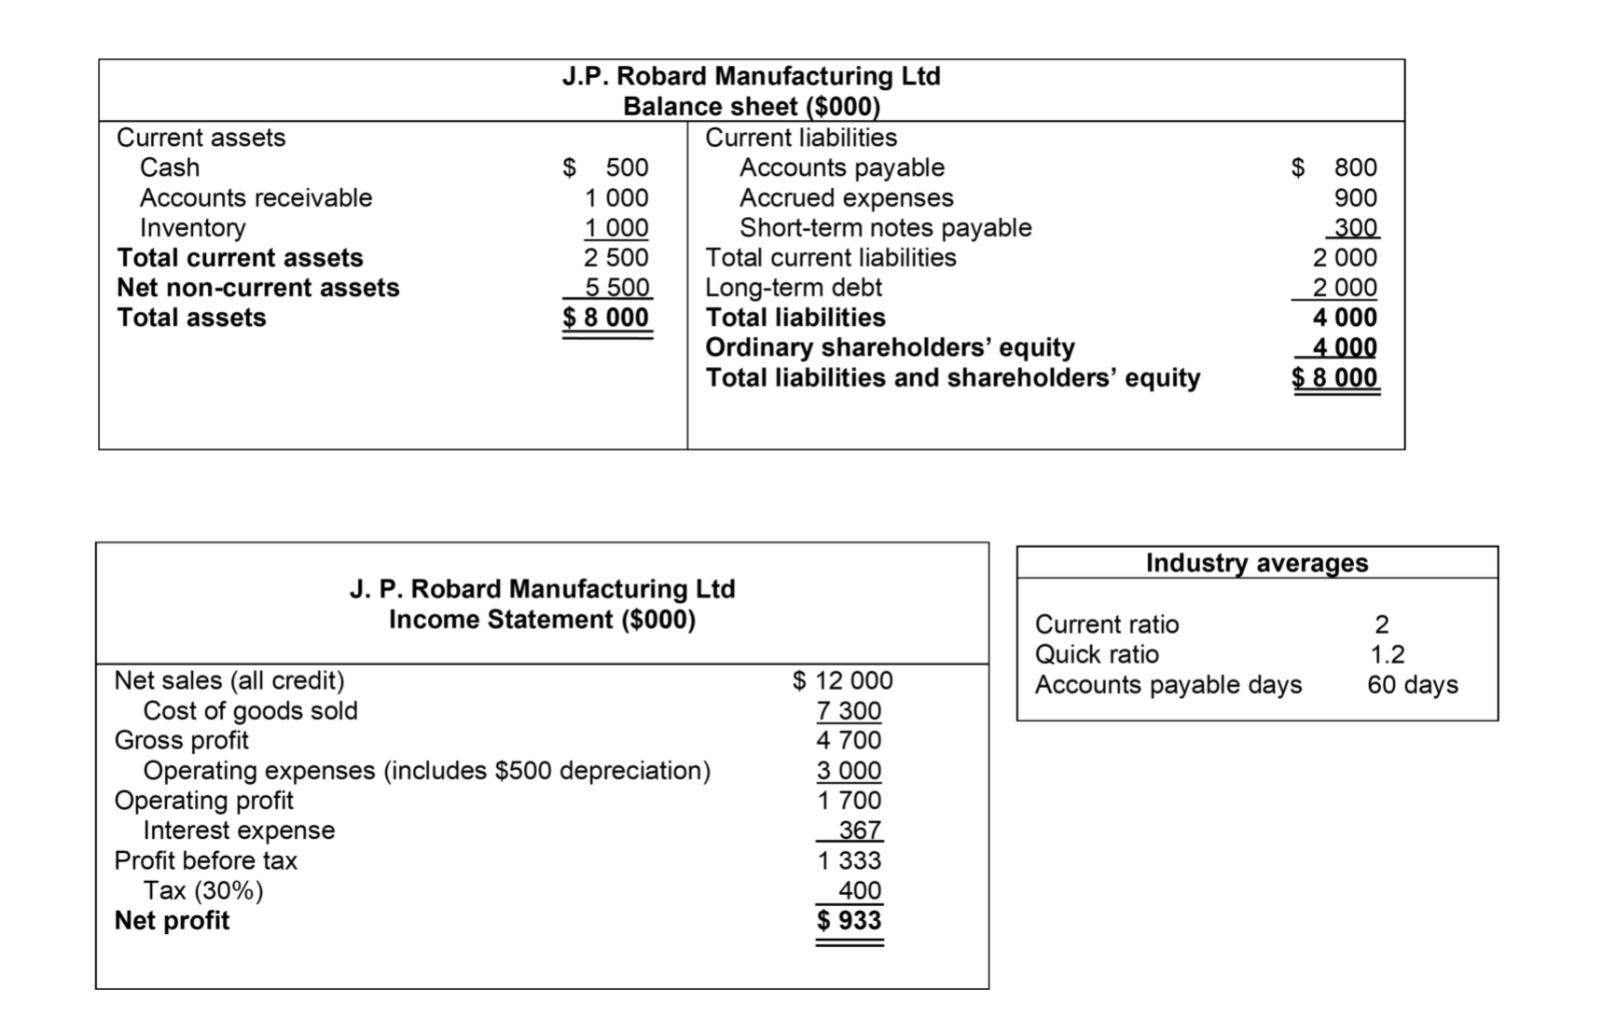
Question
1. What is the Current Ratio of the firm? 2. What is the Quick Ratio of the firm? 3. Comparing J.P. Robards calculated current and

1. What is the Current Ratio of the firm?
2. What is the Quick Ratio of the firm?
3. Comparing J.P. Robards calculated current and quick ratios to the industry averages, what can be said about the company?
A. Based on the current ratio, J.P. Robard is more liquid in comparison to the industry average as its current ratio is higher. From a quick ratio perspective, and comparing to the industry average, J.P. Robard appears to be far less liquid than it did using the current ratio.
B. Based on the current ratio, J.P. Robard is less liquid in comparison to the industry average as its current ratio is lower. From a quick ratio perspective, and comparing to the industry average, J.P. Robard appears to be far less liquid than it did using the current ratio.
C. Based on the current ratio, J.P. Robard is less liquid in comparison to the industry average as its current ratio is lower. From a quick ratio perspective, and comparing to the industry average, J.P. Robard appears to be more liquid than it did using the current ratio.
D. Based on the current ratio, J.P. Robard is more liquid in comparison to the industry average as its current ratio is higher. From a quick ratio perspective, and comparing to the industry average, J.P. Robard appears to be more liquid than it did using the current ratio.
(I will give you upvote)
Current assets Cash Accounts receivable Inventory Total current assets Net non-current assets Total assets J.P. Robard Manufacturing Ltd Balance sheet ($000). Current liabilities $ 500 Accounts payable 1 000 Accrued expenses 1 000 Short-term notes payable 2 500 Total current liabilities 5 500 Long-term debt $ 8 000 Total liabilities Ordinary shareholders' equity Total liabilities and shareholders' equity $ 800 900 300 2 000 2 000 4 000 4 000 $ 8 000 Industry averages J. P. Robard Manufacturing Ltd Income Statement ($000) Current ratio Quick ratio Accounts payable days 2 1.2 60 days Net sales (all credit) Cost of goods sold Gross profit Operating expenses (includes $500 depreciation) Operating profit Interest expense Profit before tax Tax (30%) Net profit $ 12 000 7 300 4 700 3 000 1 700 _367 1 333 400 $ 933Step by Step Solution
There are 3 Steps involved in it
Step: 1

Get Instant Access to Expert-Tailored Solutions
See step-by-step solutions with expert insights and AI powered tools for academic success
Step: 2

Step: 3

Ace Your Homework with AI
Get the answers you need in no time with our AI-driven, step-by-step assistance
Get Started


