

1. What is your assessment of Starbucks' financial performance? Compute financial analysis and show work. 2. Calculate the Gross Profit and the Gross Profit Percentage
1. What is your assessment of Starbucks' financial performance? Compute financial analysis and show work.
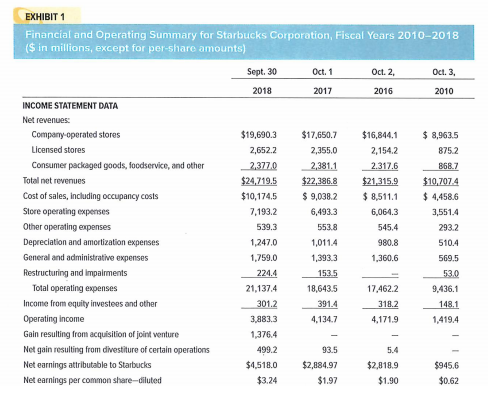
2. Calculate the Gross Profit and the Gross Profit Percentage for this year, and last year creating a small table, as follows:
3. Write a short paragraph explaining what created the above numbers to be true. (Example: Sales decreased, gross profit increased, and the gross profit percentage increased. Therefore, sales are more profitable.)
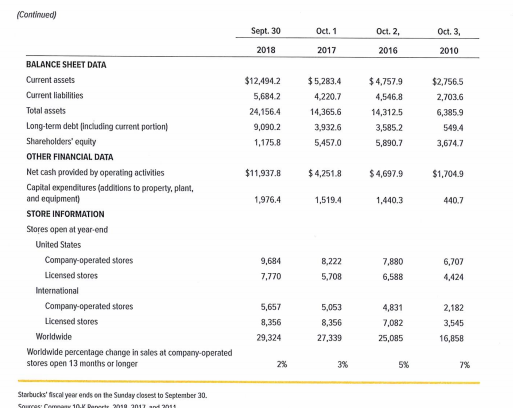
EXHIBIT 1 Financial and Operating Summary for Starbucks Corporation, Fiscal Years 2010-2018 ($ in millions, except for per-share amounts) Sept. 30 2018 Oct. 1 2017 Oct. 2, 2016 Oct. 3, 2010 $16,844.1 2,1542 2.317.6 $21,315.9 $ 8,511.1 6,064.3 INCOME STATEMENT DATA Net revenues: Company operated stores Licensed stores Consumer packaged goods, foodservice, and other Total net revenues Cost of sales, including occupancy costs Store operating expenses Other operating expenses Depreciation and amortization expenses General and administrative expenses Restructuring and impairments Total operating expenses Income from equity investees and other Operating income Gain resulting from acquisition of joint venture Net gain resulting from divestiture of certain operations Net earnings attributable to Starbucks Net earnings per common share-diluted $19,690.3 2,652.2 2.377.0 $24,719.5 $10,174.5 7.193.2 539.3 1,247.0 1,759.0 224.4 21,137.4 301.2 3,883.3 1,376.4 499.2 $4,518.0 $3.24 $17.650.7 2,355.0 2,381.1 $22,386.8 $ 9,038.2 6,493.3 553.8 1,0114 1,393.3 1535 18,643.5 391.4 4.1347 545,4 $ 8,963.5 8752 868.7 $10,7074 $ 4,458.6 3,5514 293.2 5104 569.5 980.8 1,360.6 17,462.2 3182 9,436.1 148.1 1.4194 4,171.9 93.5 $2,884.97 $1.97 $2,818.9 $1.90 $945,6 $0.62 (Continued Sept. 30 Oct. 1 Oct. 2. Oct. 3 2010 2018 2017 2016 BALANCE SHEET DATA $12.494.2 5,684.2 24,156.4 9,090.2 1,175.8 $5,283.4 4.220.7 14,365.6 3,932.6 5,457.0 $4,757.9 4,546.8 14,312.5 3,5852 5,890.7 $2,756.5 2,703.6 6,385.9 549.4 3,674.7 $11,937.8 $ 4,251.8 $4,697.9 $1,704.9 1,976.4 1,519.4 1.440.3 4407 Current assets Current liabilities Total assets Long-term debt (including current portion Shareholders' equity OTHER FINANCIAL DATA Net cash provided by operating activities Capital expenditures (additions to property, plant, and equipment STORE INFORMATION Stores open at year end United States Company operated stores Licensed stores International Company operated stores Licensed stores Worldwide Worldwide percentage change in sales at company operated stores open 13 months or longer 9,684 7,770 8,222 5,708 7,880 6,588 6,707 4,424 2,182 5,657 8,356 29,324 5,053 8,356 27,339 4,831 7,082 25,085 3,545 16,858 2% 3% 5% Starbucks' fiscal year ends on the Sunday closest to September 30 EXHIBIT 1 Financial and Operating Summary for Starbucks Corporation, Fiscal Years 2010-2018 ($ in millions, except for per-share amounts) Sept. 30 2018 Oct. 1 2017 Oct. 2, 2016 Oct. 3, 2010 $16,844.1 2,1542 2.317.6 $21,315.9 $ 8,511.1 6,064.3 INCOME STATEMENT DATA Net revenues: Company operated stores Licensed stores Consumer packaged goods, foodservice, and other Total net revenues Cost of sales, including occupancy costs Store operating expenses Other operating expenses Depreciation and amortization expenses General and administrative expenses Restructuring and impairments Total operating expenses Income from equity investees and other Operating income Gain resulting from acquisition of joint venture Net gain resulting from divestiture of certain operations Net earnings attributable to Starbucks Net earnings per common share-diluted $19,690.3 2,652.2 2.377.0 $24,719.5 $10,174.5 7.193.2 539.3 1,247.0 1,759.0 224.4 21,137.4 301.2 3,883.3 1,376.4 499.2 $4,518.0 $3.24 $17.650.7 2,355.0 2,381.1 $22,386.8 $ 9,038.2 6,493.3 553.8 1,0114 1,393.3 1535 18,643.5 391.4 4.1347 545,4 $ 8,963.5 8752 868.7 $10,7074 $ 4,458.6 3,5514 293.2 5104 569.5 980.8 1,360.6 17,462.2 3182 9,436.1 148.1 1.4194 4,171.9 93.5 $2,884.97 $1.97 $2,818.9 $1.90 $945,6 $0.62 (Continued Sept. 30 Oct. 1 Oct. 2. Oct. 3 2010 2018 2017 2016 BALANCE SHEET DATA $12.494.2 5,684.2 24,156.4 9,090.2 1,175.8 $5,283.4 4.220.7 14,365.6 3,932.6 5,457.0 $4,757.9 4,546.8 14,312.5 3,5852 5,890.7 $2,756.5 2,703.6 6,385.9 549.4 3,674.7 $11,937.8 $ 4,251.8 $4,697.9 $1,704.9 1,976.4 1,519.4 1.440.3 4407 Current assets Current liabilities Total assets Long-term debt (including current portion Shareholders' equity OTHER FINANCIAL DATA Net cash provided by operating activities Capital expenditures (additions to property, plant, and equipment STORE INFORMATION Stores open at year end United States Company operated stores Licensed stores International Company operated stores Licensed stores Worldwide Worldwide percentage change in sales at company operated stores open 13 months or longer 9,684 7,770 8,222 5,708 7,880 6,588 6,707 4,424 2,182 5,657 8,356 29,324 5,053 8,356 27,339 4,831 7,082 25,085 3,545 16,858 2% 3% 5% Starbucks' fiscal year ends on the Sunday closest to September 30
Step by Step Solution
There are 3 Steps involved in it
Step: 1

See step-by-step solutions with expert insights and AI powered tools for academic success
Step: 2

Step: 3
Ace Your Homework with AI
Get the answers you need in no time with our AI-driven, step-by-step assistance
Get Started
Authors: Nisha S Koshal
1946822078, 978-1946822079