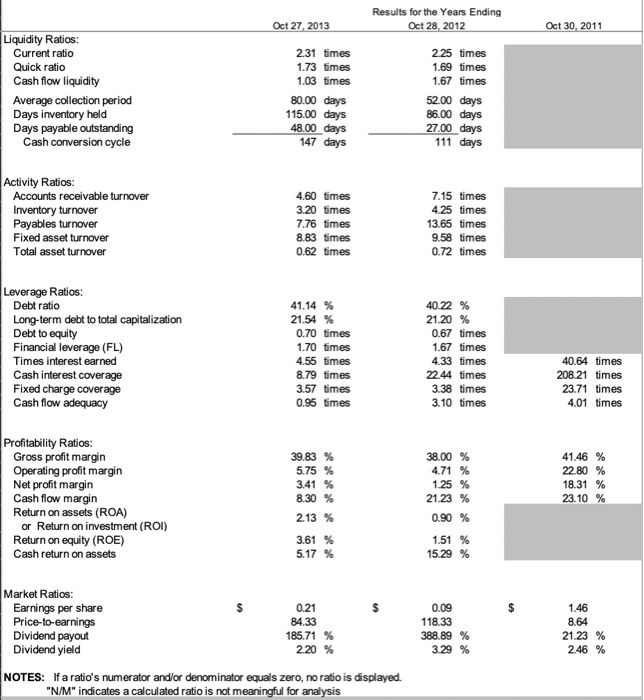
1. What is your companys gross profit margin? What trend do you see (increase or decrease) over the years you are evaluating?
2. What is your companys operating profit margin? What trend do you see (increase or decrease) over the years you are evaluating?
3. What is your companys net profit margin? What trend do you see (increase or decrease) over the years you are evaluating?
4. What are your thoughts about your companys profitability? Will it sustain its profits? Grow? Decline? Why?
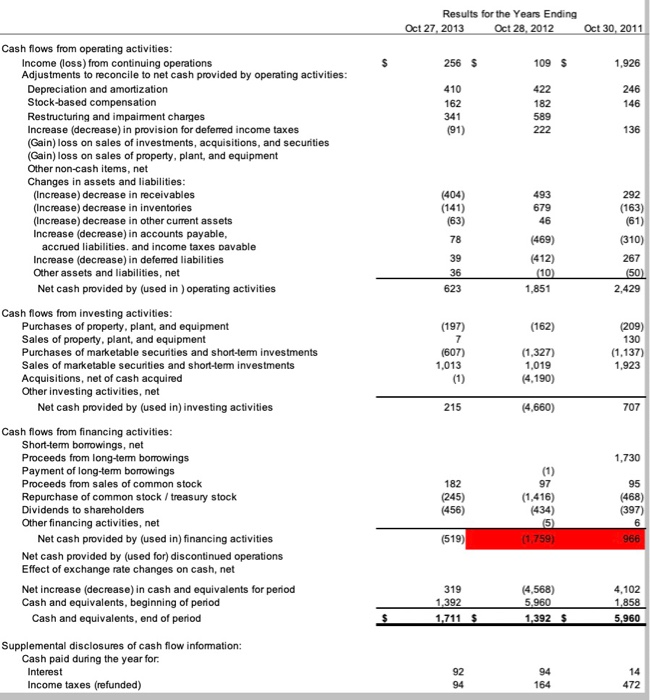
Oct 27, 2013 Results for the Years Ending Oct 28, 2012 Oct 30, 2011 Liquidity Ratios: Current ratio Quick ratio Cash flow liquidity Average collection period Days inventory held Days payable outstanding Cash conversion cycle 2.31 times 1.73 times 1.03 times 80.00 days 115.00 days 48.00 days 147 days 225 times 1.69 times 1.67 times 52.00 days 86.00 days 27.00 days 111 days Activity Ratios: Accounts receivable turnover Inventory turnover Payables turnover Fixed asset turnover Total asset turnover 4.60 times 3.20 times 7.76 times 8.83 times 0.62 times 7.15 times 4.25 times 13.65 times 9.58 times 0.72 times Leverage Ratios: Debt ratio Long-term debt to total capitalization Debt to equity Financial leverage (FL) Times interest earned Cash interest coverage Fixed charge coverage Cash flow adequacy 41.14 % 21.54 % 0.70 times 1.70 times 4.55 times 8.79 times 3.57 times 0.95 times 40.22 % 21.20 % 0.67 times 1.67 times 4.33 times 22.44 times 3.38 times 3.10 times 40.64 times 208.21 times 23.71 times 4.01 times 38.00 % 4.71 % Profitability Ratios: Gross profit margin Operating profit margin Net profit margin Cash flow margin Return on assets (ROA) or Return on investment (ROI) Return on equity (ROE) Cash return on assets 41.46 % 22.80 % 18.31 % 23.10 % good 1.25 % 21.23 % 0.90 % 1.51 % 15.29 % $ Market Ratios: Earnings per share Price-to-earnings Dividend payout Dividend yield 0.21 84.33 185.71 2.20 0.09 118.33 388.89 % 3.29 % 1.46 8.64 21.23 % 2.46 % % % NOTES: If a ratio's numerator and/or denominator equals zero, no ratio is displayed. "N/M" indicates a calculated ratio is not meaningful for analysis Results for the Years Ending Oct 27, 2013 Oct 28, 2012 Oct 30, 2011 256 $ 109 $ 1,926 422 410 162 182 246 146 341 589 222 (91) Cash flows from operating activities: Income (loss) from continuing operations Adjustments to reconcile to net cash provided by operating activities: Depreciation and amortization Stock-based compensation Restructuring and impairment charges Increase (decrease) in provision for deferred income taxes (Gain) loss on sales of investments, acquisitions, and securities (Gain) loss on sales of property, plant, and equipment Other non-cash items, net Changes in assets and liabilities: (Increase) decrease in receivables (Increase) decrease in inventories (Increase) decrease in other current assets Increase (decrease) in accounts payable, accrued liabilities, and income taxes pavable Increase (decrease) in deferred liabilities Other assets and liabilities, net Net cash provided by (used in ) operating activities 493 679 46 (404) (141) (63) 78 39 (469) (412) (10) 1,851 292 (163) (61) (310) 267 (50) 2,429 623 (197) (162) (209) Cash flows from investing activities: Purchases of property, plant, and equipment Sales of property, plant, and equipment Purchases of marketable securities and short-term investments Sales of marketable securities and short-term investments Acquisitions, net of cash acquired Other investing activities, net Net cash provided by (used in) investing activities (607) 1.013 (1,327) 1,019 (4.190) 130 (1.137) 1,923 215 (4,660) 707 1,730 (1) 97 182 (245) (456) Cash flows from financing activities: Short-term borrowings, net Proceeds from long-term borrowings Payment of long-term borrowings Proceeds from sales of common stock Repurchase of common stock/treasury stock Dividends to shareholders Other financing activities, net Net cash provided by (used in) financing activities Net cash provided by (used for) discontinued operations Effect of exchange rate changes on cash, net Net increase (decrease) in cash and equivalents for period Cash and equivalents, beginning of period Cash and equivalents, end of period 95 (468) (397) (1,416) (434) (5) (1.759) (519) 966 319 1.392 1.711 $ (4,568) 5.960 1.392 4,102 1,858 5.960 $ $ Supplemental disclosures of cash flow information: Cash paid during the year for. Interest Income taxes (refunded) 94 164 472


