Answered step by step
Verified Expert Solution
Question
1 Approved Answer
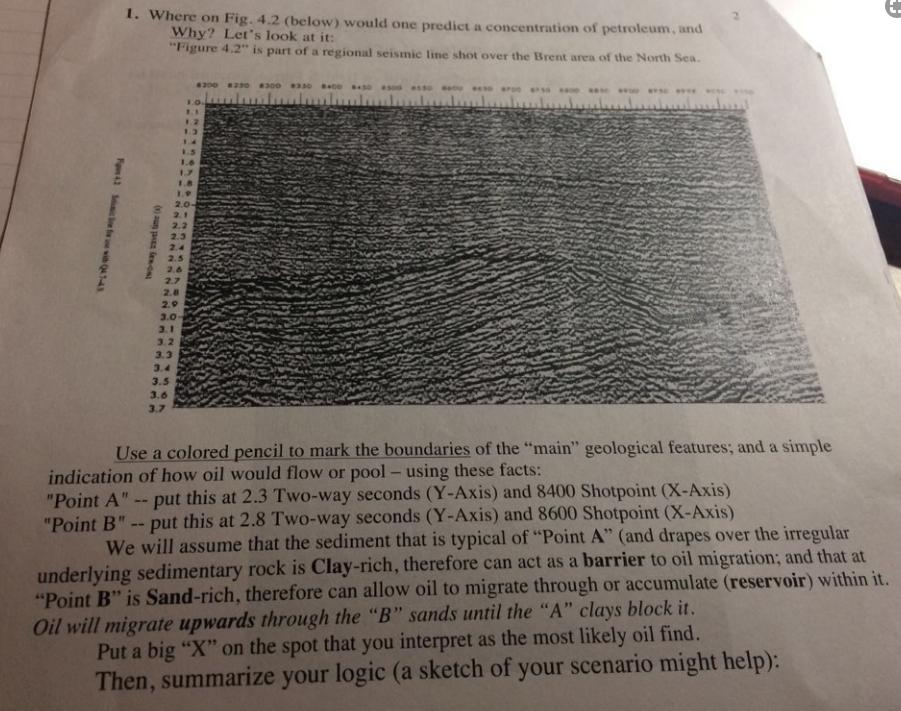
1. Where on Fig. 4.2 (below) would one predict a concentration of petroleum, and Why? Let's look at it: Figure 4.2 is part of

1. Where on Fig. 4.2 (below) would one predict a concentration of petroleum, and Why? Let's look at it: "Figure 4.2" is part of a regional seismic line shot over the Brent area of the North Sea. 6200 2 O 8300 os s5 PO e 10. 2.0 2.1 2.2 2.3 2.4 2.5 2.6 2.7 2.8 2.9 3.0 3.1 3.2 3.3 3.4 3.5 3.6 3.7 Use a colored pencil to mark the boundaries of the "main" geological features; and a simple indication of how oil would flow or pool - using these facts: "Point A" -- put this at 2.3 Two-way seconds (Y-Axis) and 8400 Shotpoint (X-Axis) "Point B" -- put this at 2.8 Two-way seconds (Y-Axis) and 8600 Shotpoint (X-Axis) We will assume that the sediment that is typical of "Point A" (and drapes over the irregular underlying sedimentary rock is Clay-rich, therefore can act as a barrier to oil migration; and that at "Point B" is Sand-rich, therefore can allow oil to migrate through or accumulate (reservoir) within it. Oil will migrate upwards through the "B" sands until the "A" clays block it. Put a big "X" on the spot that you interpret as the most likely oil find. Then, summarize your logic (a sketch of your scenario might help): 0aun p leos Fon4 fw wi 4143
Step by Step Solution
★★★★★
3.58 Rating (151 Votes )
There are 3 Steps involved in it
Step: 1
The rock unit located at the base of the seismic line and bounded by the pink line could be a seal r...
Get Instant Access to Expert-Tailored Solutions
See step-by-step solutions with expert insights and AI powered tools for academic success
Step: 2

Step: 3

Ace Your Homework with AI
Get the answers you need in no time with our AI-driven, step-by-step assistance
Get Started


