

Question
1. Which age group represents the highest percentage of taxpayers in 2018? 2. Which two age groups have seen the sharpest increase as a percentage
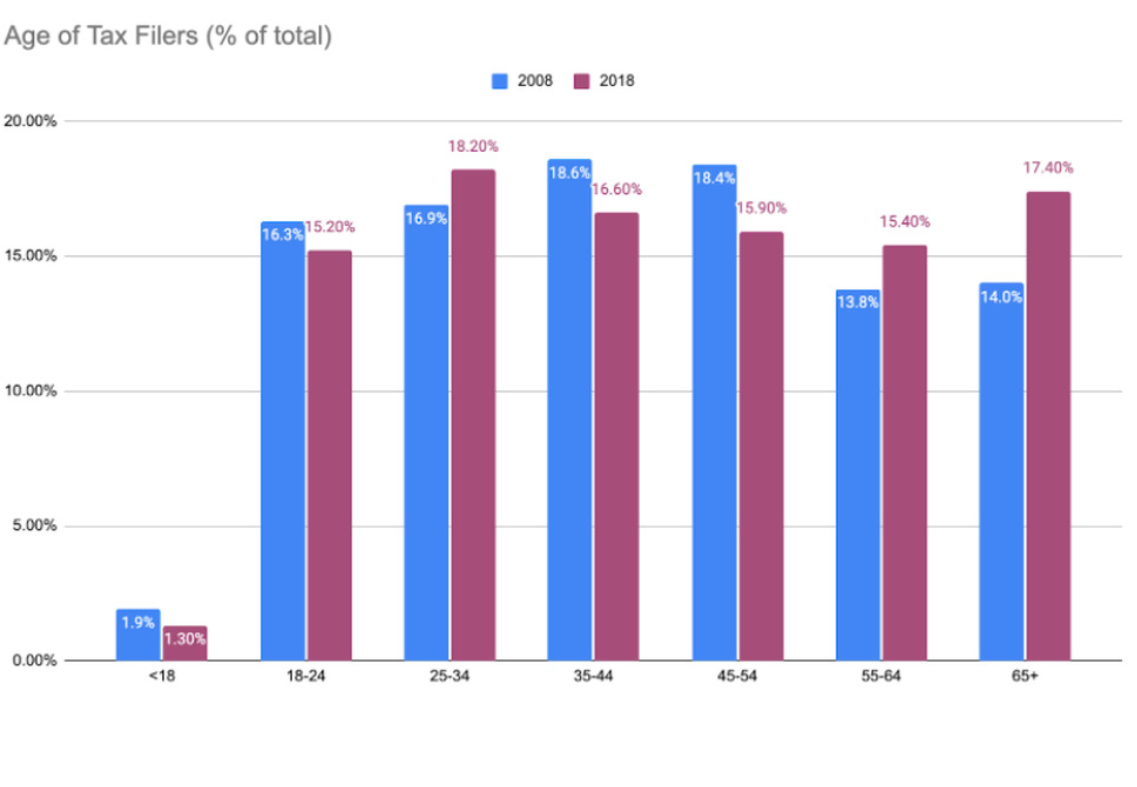
1. Which age group represents the highest percentage of taxpayers in 2018?
2. Which two age groups have seen the sharpest increase as a percentage of taxpayers from 2008 to 2018?
3. Why do you think the percentage of tax filers has most dramatically increased for the 65+ group?
4. What do you think causes the percent of filers to jump so dramatically between the under-18 group and the 18-24 group.
5. What might have to happen in the US for any dramatic changes to occur in future versions of this graph?
Step by Step Solution
There are 3 Steps involved in it
Step: 1

Get Instant Access to Expert-Tailored Solutions
See step-by-step solutions with expert insights and AI powered tools for academic success
Step: 2

Step: 3
Ace Your Homework with AI
Get the answers you need in no time with our AI-driven, step-by-step assistance
Get Started
New Horizons In The Field Of Management Audit As A Tool For Improving The Overall Management Of Enterprises A Guideline For Good Governance
Authors: Mohammed Sakhawat Hossain
1st Edition
3639194454, 978-3639194456