Question
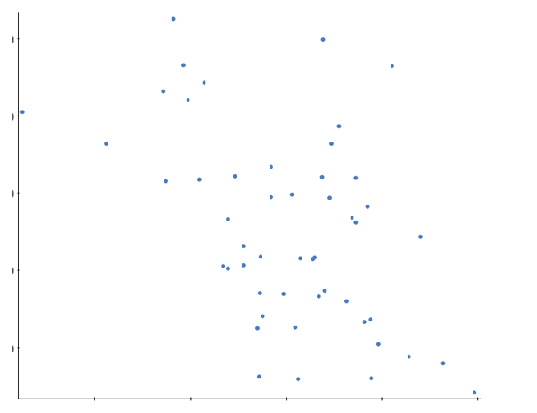
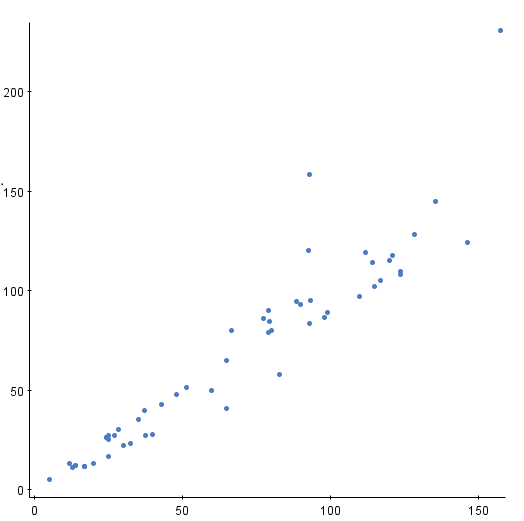
1) Which of the following numbers represents the correlation forthe above scatter plot? Select one: -0.49 -0.95 -0.98 0.57 0.34 0.89 2) Which of the

1) Which of the following numbers represents the correlation forthe above scatter plot?
Select one:
-0.49
-0.95
-0.98
0.57
0.34
0.89

2) Which of the following numbers represents the correlation forthe above scatter plot?
Select one:
0.94
0.23
0.32
-0.97
-0.68
-0.35

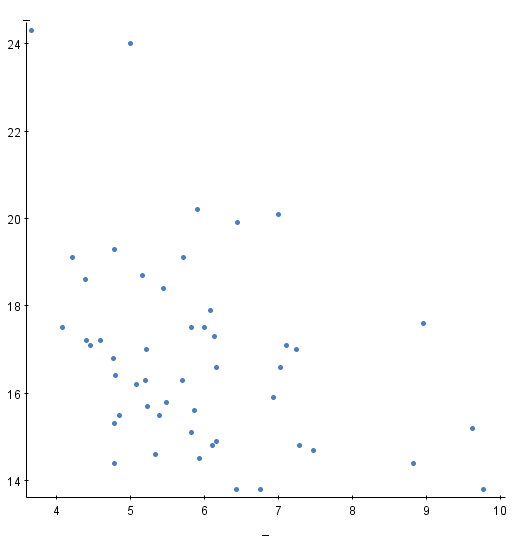
3) The coefficient of determination, r2, for theabove scatter plot is 0.138. What is the correlation coefficient,r? Give your answer to 3 decimal places. For help on how to input anumeric answer, please see "Instructions for inputting a numericresponse."
Step by Step Solution
3.48 Rating (158 Votes )
There are 3 Steps involved in it
Step: 1

Get Instant Access to Expert-Tailored Solutions
See step-by-step solutions with expert insights and AI powered tools for academic success
Step: 2

Step: 3

Ace Your Homework with AI
Get the answers you need in no time with our AI-driven, step-by-step assistance
Get StartedRecommended Textbook for
Understanding Basic Statistics
Authors: Charles Henry Brase, Corrinne Pellillo Brase
6th Edition
978-1133525097, 1133525091, 1111827028, 978-1133110316, 1133110312, 978-1111827021
Students also viewed these Mathematics questions
Question
Answered: 1 week ago
Question
Answered: 1 week ago
Question
Answered: 1 week ago
Question
Answered: 1 week ago
Question
Answered: 1 week ago
Question
Answered: 1 week ago
Question
Answered: 1 week ago
Question
Answered: 1 week ago
Question
Answered: 1 week ago
Question
Answered: 1 week ago
Question
Answered: 1 week ago
Question
Answered: 1 week ago
Question
Answered: 1 week ago
Question
Answered: 1 week ago
Question
Answered: 1 week ago
Question
Answered: 1 week ago
Question
Answered: 1 week ago
Question
Answered: 1 week ago
Question
Answered: 1 week ago
Question
Answered: 1 week ago
View Answer in SolutionInn App


