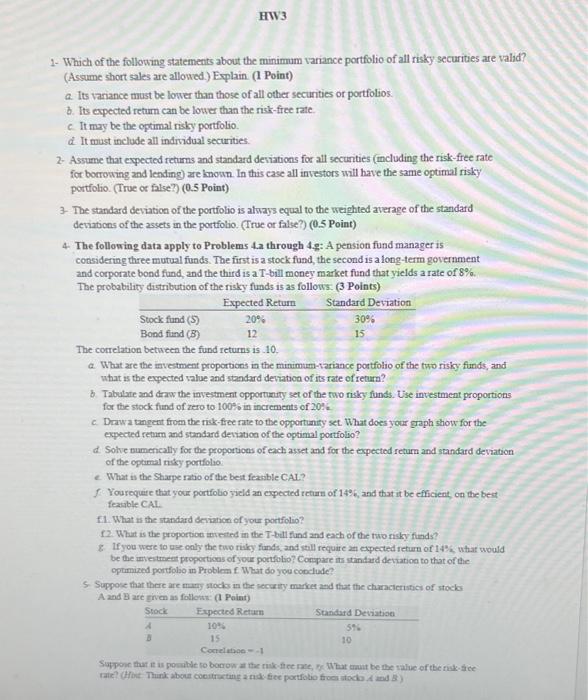
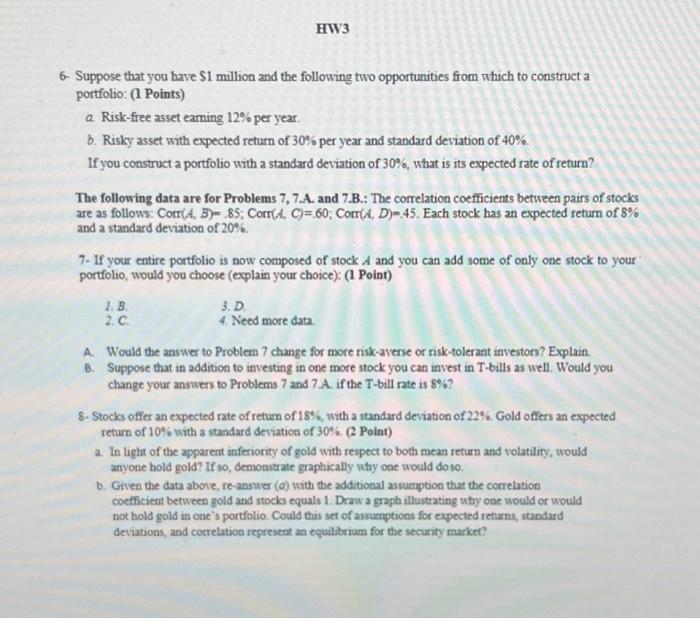
1- Which of the following statements about the minimum variance portfolio of all risky securities are valid? (Assume short sales are allowed.) Explain (1 Point) a. Its variance must be lower than those of all other securities or portfolios. b. Its expected retum can be lower than the risk-free rate c. It may be the optimal risky portfolio. d. It must include all indridual securities. 2. Assume that expected returns and standard deviations for all secunties (including the risk-free rate for bocrowing and lending) are known. In this case all investers will have the same optimal risky portfolio. (True or false?) (0.5 Point) 3. The standard deviation of the portfolio is always equal to the weighted average of the standard deviations of the assets in the portfolio. (True or false?) ( 0.5 Point) 4. The following data apply to Problems 4.a through 4.g: A pension fund manager is considering three mutual funds. The first is a stock fund, the second is a long-term government and corporate bond fund, and the third is a T-bill money market fund that yields a rate of 8%. The probability distribution of the risky funds is as follows: (3 Points) The correlation between the fund returns is .10. a. What are the investment proportions in the minimum-tariance portfolio of the two risky funds, and uhat is the expected value and standard deriation of its rate of return? b. Tabulate and draw the inverment opportanty set of the rwo risky funds. Use investment proportions for the stock fund of zero to 100% in increments of 20%N c. Draw a tangent from the risk-free rate to the opportianity set. What does your gaph show for the expected retam and standard deviation of the optimal portfolio? d. Solve numenically for the peoportions of each asset and for the expected return and sandard deviation of the optimil risy portfolio e. What is the Sharpe ratio of the beit feasble CAL? f. Yourequire that your portfolio yield an expected return of 1496 , and that it be efficient on the beat feavble CAt. fi. What is the standard deriation of your portfolio? 12. What is the proportion meted in the T-bill fund and each of the ruo risky finds? 8. If you were to ase only the two rikky finds, and tell require as expected return of 14%, wtar would be the imvertmeat properticas of your portbbio? Conpare its standard deviation to that of the oprmized portolob in Problem f. What do you conclude? 5. Suppose that there are many stocks in the securty market and that the characteristics of stocks A and B are riven as followe A Paint Suppose that you have $1 million and the following two opportunities from which to construct a portfolio: (1 Points) a. Risk-free asset eaming 12% per year. b. Risky asset with expected return of 30% per year and standard deviation of 40%. If you construct a portfolio with a standard deviation of 30%, what is its expected rate of return? The following data are for Problems 7, 7.A. and 7.B.: The correlation coefficients between pairs of stocks are as follows: Corr(A,B)=85;Corr(A,C)=60;Corr(A,D)=45. Each stock has an expected return of 8% and a standard deviation of 20%. 7- If your entire portfolio is now composed of stock A and you can add some of only one stock to your portfolio, would you choose (explain your choice): (1 Point) 1. B. 2. C. 3. D. 4. Need more data. A. Would the answer to Problem 7 change for more risk-averse or risk-tolerant investors? Explain. B. Suppose that in addition to investing in one more stock you can invest in T-bills as well. Would you change your answers to Problems 7 and 7 . . if the T-bill rate is 8% ? 8. Stocks offer an expected rate of retum of 18%, with a standard deviation of 22%. Gold offers an expected return of 10% with a standard deviation of 30%. (2 Point) a. In light of the apparent inferiority of gold with respect to both mean return and volatility, would anyone hold gold? If so, demonstrate graphically why cae would doso. b. Given the data above, re-answer (a) with the additional assumption that the correlation coefficient between gold and stocks equals 1. Draw a graph illustrating uthy one would or would not hold gold in one's portfolio. Could this set of assumptions for expected returns, standard deviations, and correlation represent an equilibrium for the security market