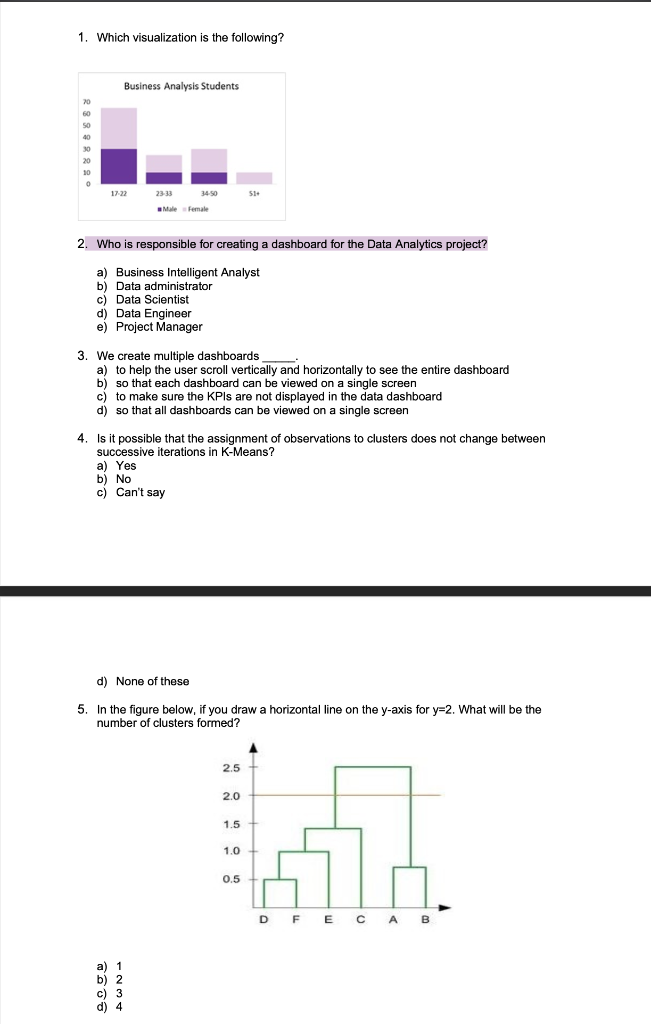
Question: 1. Which visualization is the following? 2. Who is responsible for creating a dashboard for the Data Analytics project? a) Business Intelligent Analyst b) Data

1. Which visualization is the following? 2. Who is responsible for creating a dashboard for the Data Analytics project? a) Business Intelligent Analyst b) Data administrator c) Data Scientist d) Data Engineer e) Project Manager 3. We create multiple dashboards a) to help the user scroll vertically and horizontally to see the entire dashboard b) so that each dashboard can be viewed on a single screen c) to make sure the KPIs are not displayed in the data dashboard d) so that all dashboards can be viewed on a single screen 4. Is it possible that the assignment of observations to clusters does not change between successive iterations in K-Means? a) Yes b) No c) Can't say d) None of these 5. In the figure below, if you draw a horizontal line on the y-axis for y=2. What will be the number of clusters formed
Step by Step Solution
There are 3 Steps involved in it

Get step-by-step solutions from verified subject matter experts


