

Answered step by step
Verified Expert Solution
Question
1 Approved Answer
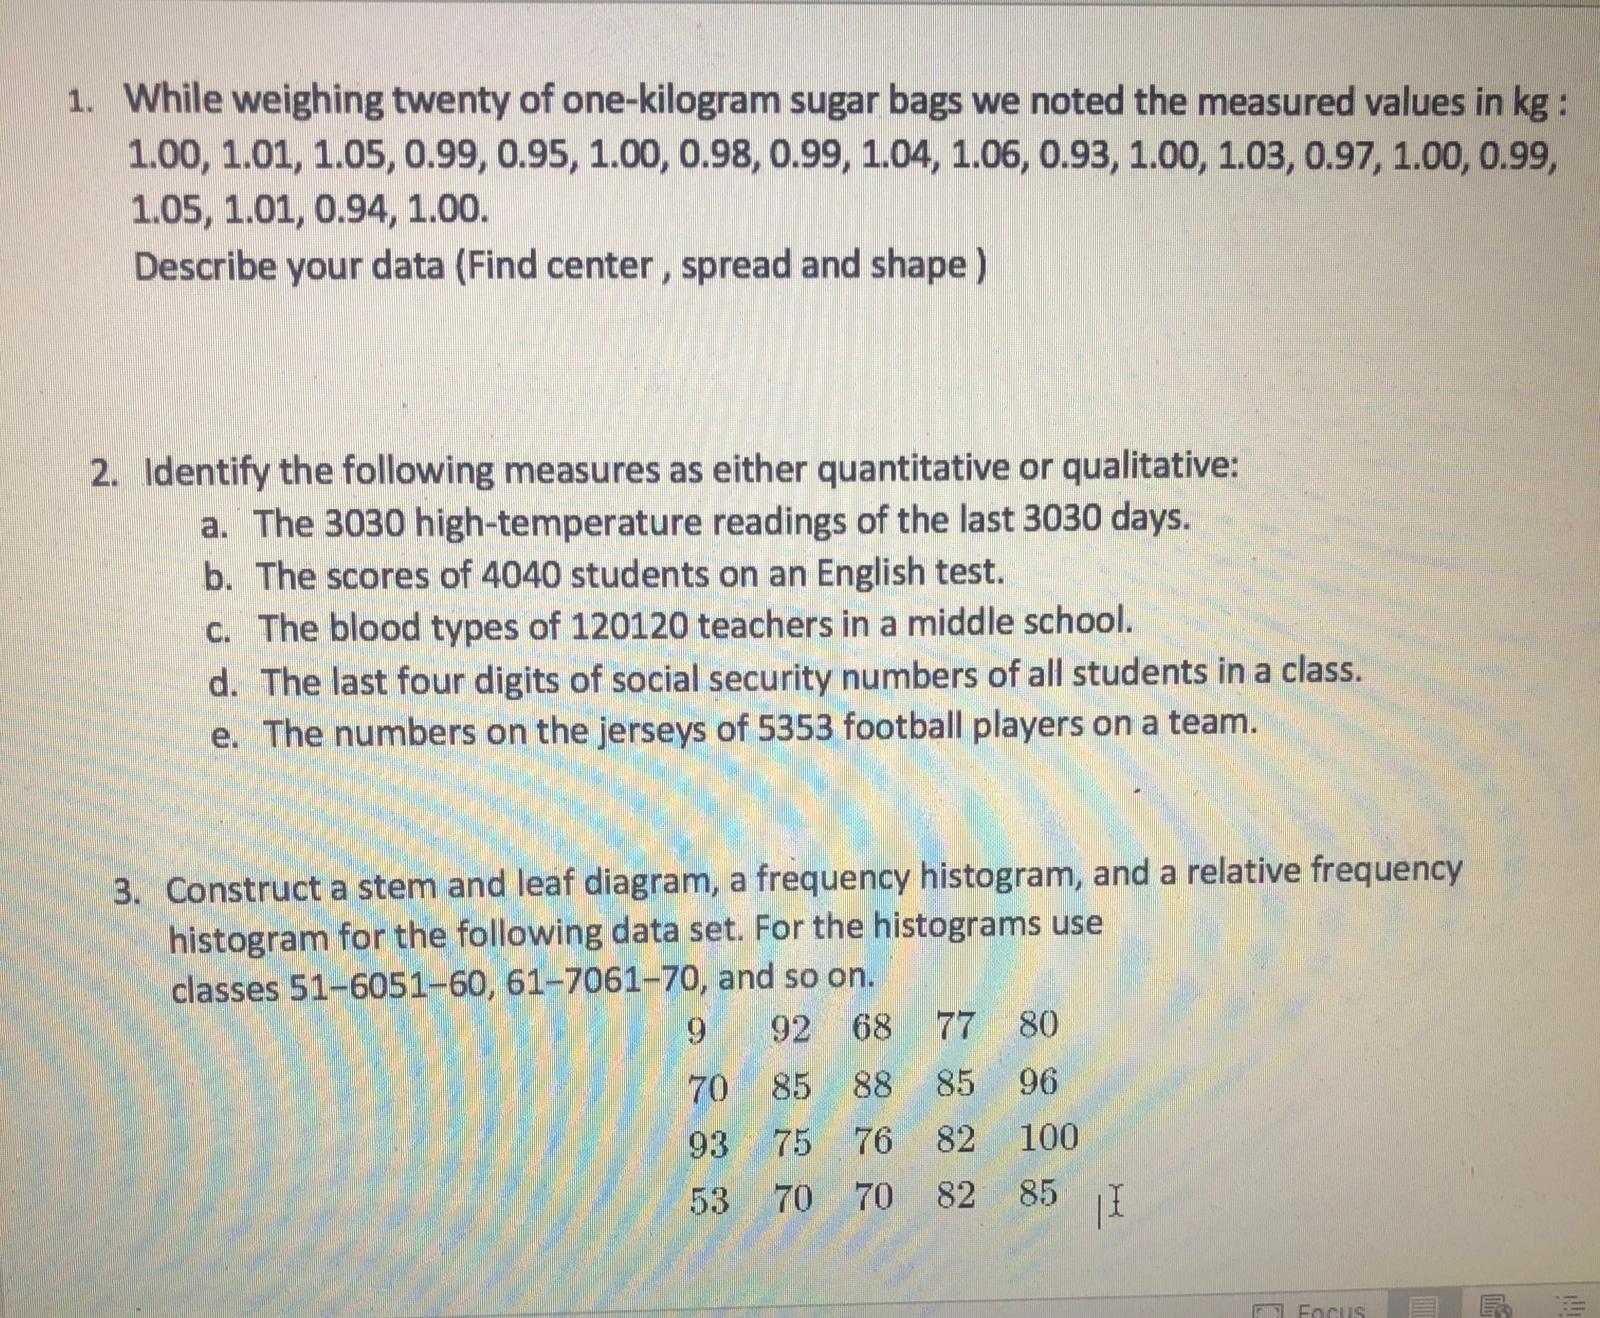
1. While weighing twenty of one-kilogram sugar bags we noted the measured values in kg : 1.00, 1.01, 1.05, 0.99, 0.95, 1.00, 0.98, 0.99, 1.04,
Step by Step Solution
There are 3 Steps involved in it
Step: 1

Get Instant Access to Expert-Tailored Solutions
See step-by-step solutions with expert insights and AI powered tools for academic success
Step: 2

Step: 3
Ace Your Homework with AI
Get the answers you need in no time with our AI-driven, step-by-step assistance
Get Started
Differential Geometry
Authors: Erwin Kreyszig
1st Edition
486667219, 978-0486667218