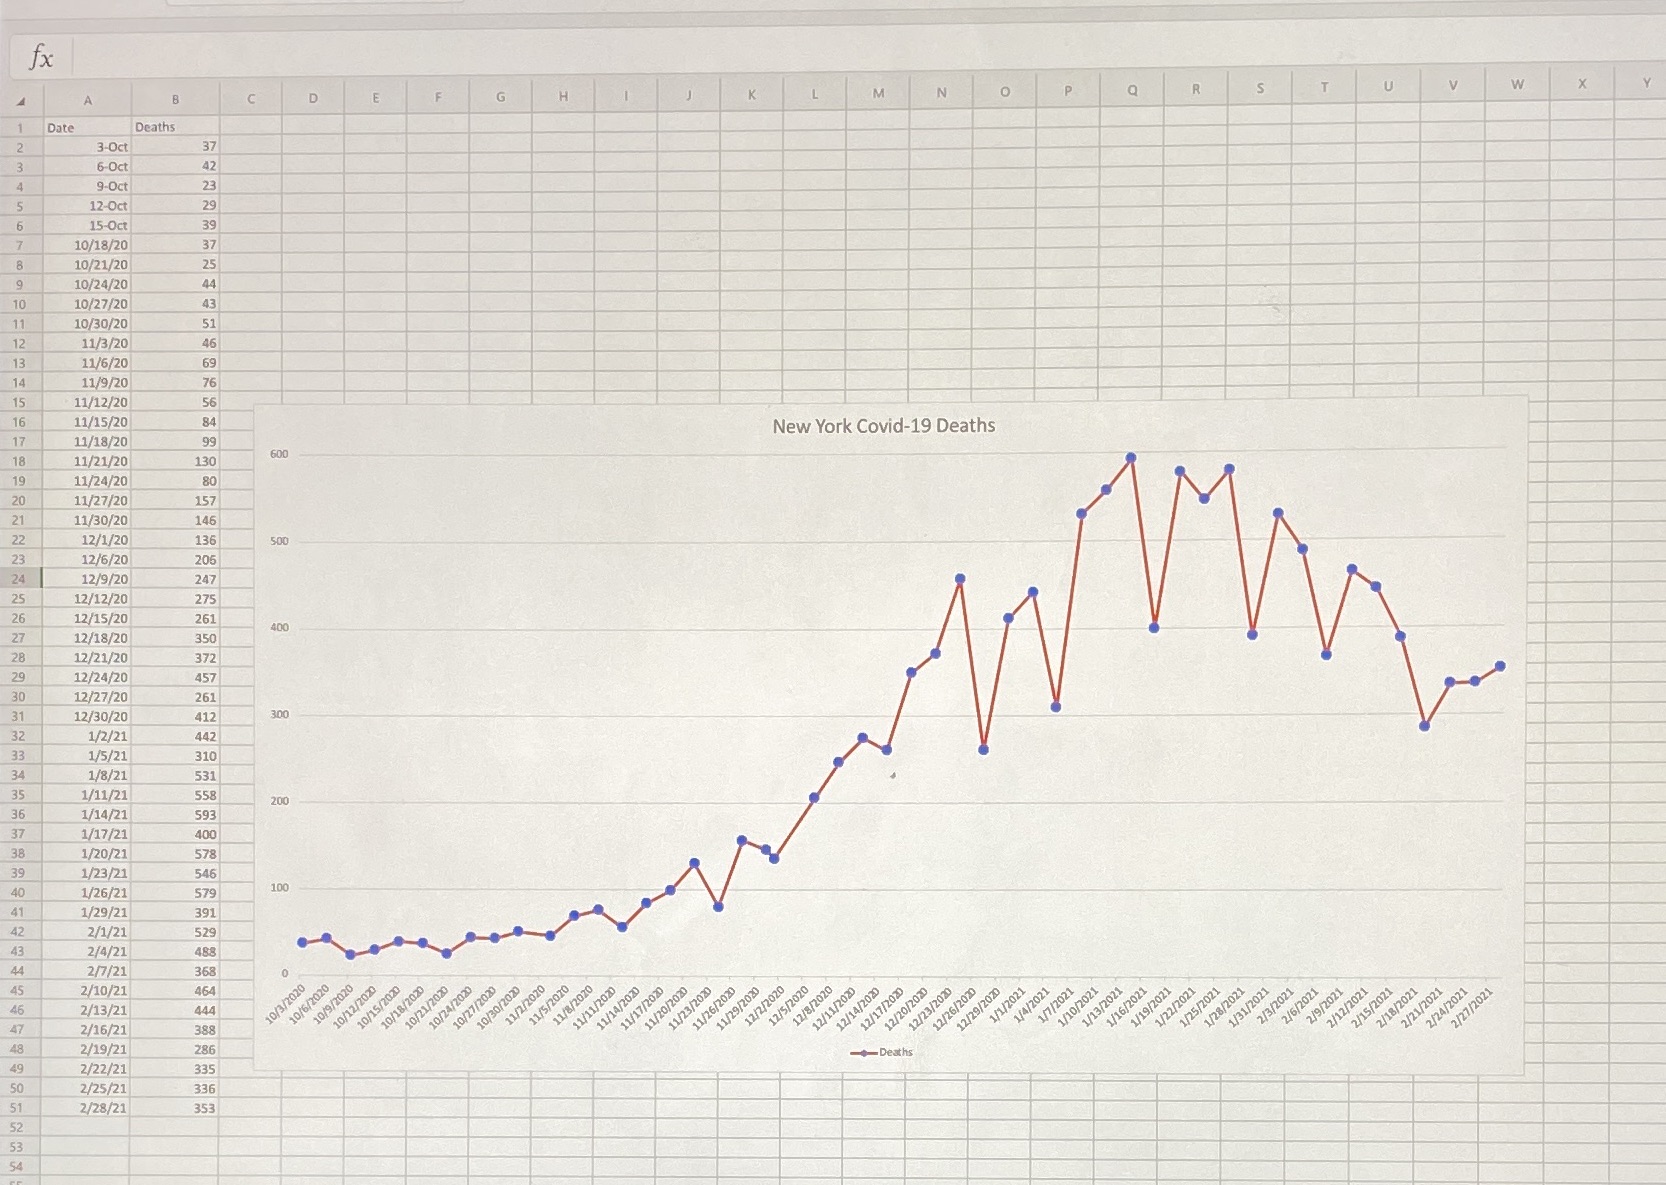
Question
1) With the data points to graph that has been constructed you will determine the slope of the graph in each month, using the following
1) With the data points to graph that has been constructed you will determine the slope of the graph in each month, using the following formula: Slope = [final number of cases /deaths - initial number of cases/ deaths]/ # of days in the month2) a) Determine the month with greatest slope value and construct the stem and leave.b) Construct the associated box plotc) Determine the five numbers summaryd) Compute the mean, determine modee) Compute the standard deviation of the number of cases in that month
Date Deaths
3-Oct. 37
6-Oct. 42
9-Oct. 23
12-Oct. 29
15Oct. 39
10/18/20. 37
10/21/20. 25
10/24/20. 44
10/27/20. 43
10/30/20. 51
11/3/20. 46
11/6/20. 69
11/9/20. 76
11/12/20. 56
11/15/20. 84
11/18/20. 99
11/21/20. 130
11/24/20. 80
11/27/20. 157
11/30/20. 146
12/1/20. 136
12/6/20. 206
12/9/20. 247
12/12/20. 275
12/15/20. 261
12/18/20. 350
12/21/20. 372
12/24/20. 457
12/27/20. 261
12/30/20. 412
1/2/21. 442
1/5/21. 310
1/8/21. 531
1/11/21. 558
1/14/21. 593
1/17/21. 400
1/20/21. 578
1/23/21. 546
1/26/21. 579
1/29/21. 391
2/1/21. 529
2/4/21. 488
2/7/21. 368
2/10/21. 464
2/13/21. 444
2/16/21. 388
2/19/21. 286
2/22/21. 335
2/25/21. 336
2/28/21. 353

Step by Step Solution
There are 3 Steps involved in it
Step: 1

Get Instant Access to Expert-Tailored Solutions
See step-by-step solutions with expert insights and AI powered tools for academic success
Step: 2

Step: 3

Ace Your Homework with AI
Get the answers you need in no time with our AI-driven, step-by-step assistance
Get Started


