Answered step by step
Verified Expert Solution
Question
1 Approved Answer
1) With the following extract of the Durbin Watson table, please help Arthur to understand if the regression residuals are suffered from serial correlation problem.
1) With the following extract of the Durbin Watson table, please help Arthur to understand if the regression residuals are suffered from serial correlation problem. Find the correct critical values, state the null hypothesis, and state your decision.
2) Arthur decides to drop PUI from above regression and add a search engine-based sentiment index (FEARS) in the regression. What potential problem should Arthur pay attention to? What test should Arthur do to check for such potential problem?.
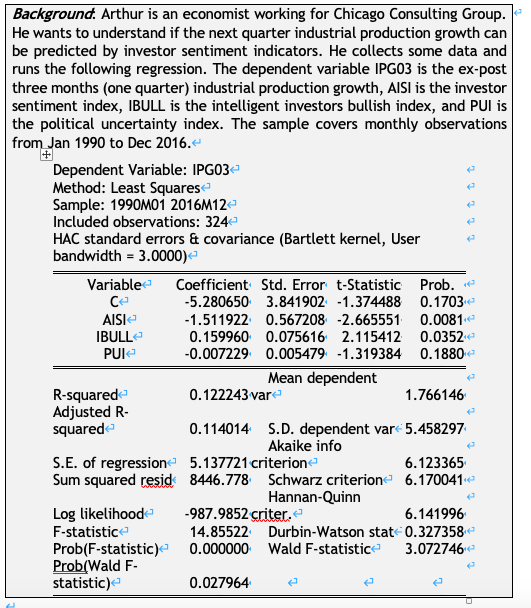
Background. Arthur is an economist working for Chicago Consulting Group. He wants to understand if the next quarter industrial production growth can be predicted by investor sentiment indicators. He collects some data and runs the following regression. The dependent variable IPG03 is the ex-post three months (one quarter) industrial production growth, AISI is the investor sentiment index, IBULL is the intelligent investors bullish index, and PUI is the political uncertainty index. The sample covers monthly observations from Jan 1990 to Dec 2016. Dependent Variable: IPG03 Method: Least Squares Sample: 1990M01 2016M12 Included observations: 324 HAC standard errors & covariance (Bartlett kernel, User bandwidth = 3.0000) Variable Coefficient Std. Error t-Statistic Prob. -5.280650 3.841902 -1.374488 0.17032 AISI -1.511922 0.567208 -2.665551 0.0081 IBULL 0.159960 0.075616 2.115412 0.0352 PUI -0.007229 0.005479 -1.319384 0.1880 Mean dependent R-squared 0.122243 var 1.766146 Adjusted R- squared 0.114014 S.D. dependent var 5.458297 Akaike info S.E. of regression 5.137721 criterion 6.123365 Sum squared resid 8446.778 Schwarz criterion 6.170041 Hannan-Quinn Log likelihood -987.9852 criter. 6.141996 F-statistic 14.85522 Durbin-Watson stat 0.327358 Prob(F-statistic) 0.000000 Wald F-statistic 3.072746 Prob(Wald F- statistic) 0.027964 k=1 k=5 n dL dU 100 150 200 250 300 350 400 1.654 1.720 1.758 1.785 1.804 1.819 1.831 Durbin-Watson Statistics: 1 Per Cent Significance Points of dL and du k=2 k=3 k=4 du dL du dL du dL du dl 1.694 1.634 1.715 1.613 1.736 1.592 1.758 1.571 1.747 1.706 1.760 1.693 1.774 1.679 1.788 1.665 1.779 1.748 1.789 1.738 1.799 1.728 1.809 1.718 1.801 1.777 1.809 1.769 1.817 1.760 1.825 1.752 1.817 1.797 1.824 1.791 1.831 1.784 1.838 1.777 1.830 1.813 1.836 1.807 1.842 1.802 1.848 1.796 1.841 1.826 1.846 1.821 1.851 1.816 1.856 1.811 1.780 1.802 1.820 1.834 1.845 1.854 1.861Step by Step Solution
There are 3 Steps involved in it
Step: 1
Get Instant Access to Expert-Tailored Solutions
See step-by-step solutions with expert insights and AI powered tools for academic success
Step: 2
Step: 3
Ace Your Homework with AI
Get the answers you need in no time with our AI-driven, step-by-step assistance
Get Started