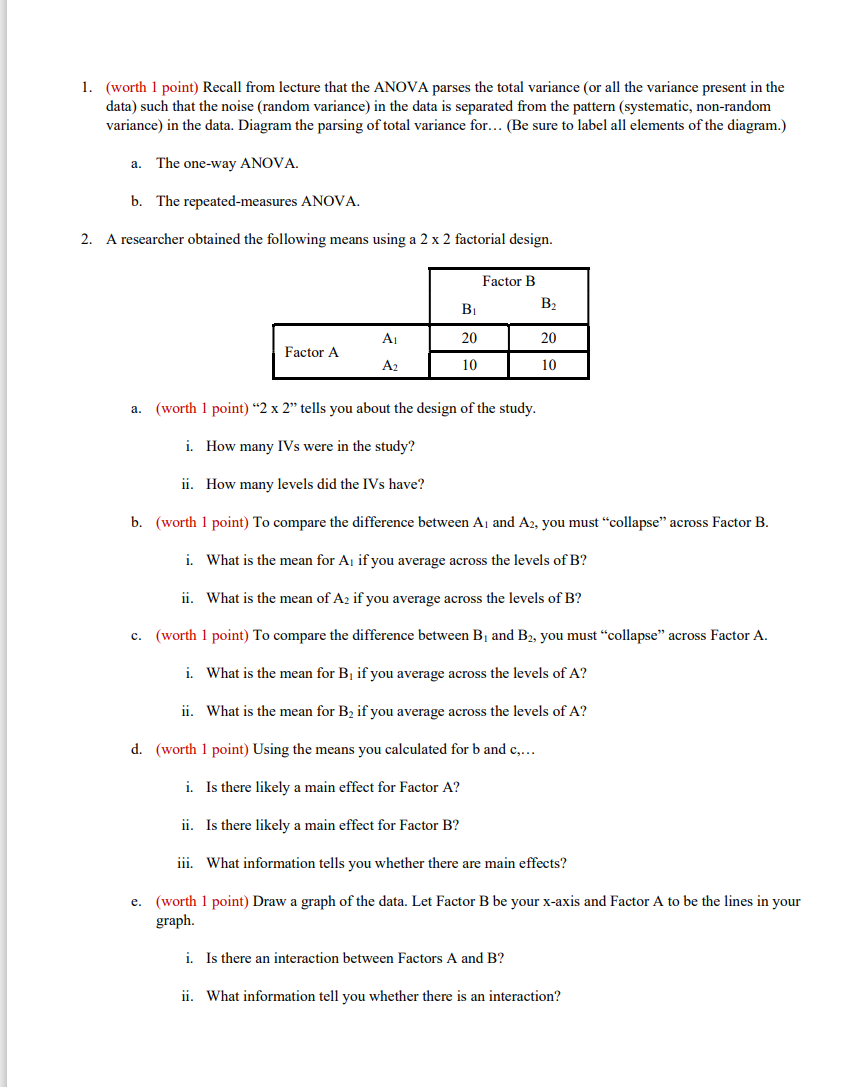
Question: 1. (worth 1 point) Recall from lecture that the ANOVA parses the total variance (or all the variance present in the data) such that the

1. (worth 1 point) Recall from lecture that the

1. (worth 1 point) Recall from lecture that the ANOVA parses the total variance (or all the variance present in the data) such that the noise (random variance) in the data is separated from the pattern (systematic, non-random variance) in the data. Diagram the parsing of total variance for... (Be sure to label all elements of the diagram.) a. The one-way ANOVA. b. The repeated-measures ANOVA. 2. A researcher obtained the following means using a 2 x 2 factorial design. Factor B B2 , A 20 20 Factor A A2 10 10 a. (worth 1 point) "2 x 2" tells you about the design of the study. i. How many IVs were in the study? ii. How many levels did the IVs have? b. (worth 1 point) To compare the difference between A, and A2, you must "collapse across Factor B. i. What is the mean for A, if you average across the levels of B? ii. What is the mean of Az if you average across the levels of B? c. (worth 1 point) To compare the difference between B and B2, you must "collapse" across Factor A. i. What is the mean for B, if you average across the levels of A? ii. What is the mean for B, if you average across the levels of A? d. (worth 1 point) Using the means you calculated for b and C.... i. Is there likely a main effect for Factor A? ii. Is there likely a main effect for Factor B? iii. What information tells you whether there are main effects? e. (worth 1 point) Draw a graph of the data. Let Factor B be your x-axis and Factor A to be the lines in your graph. i. Is there an interaction between Factors A and B? ii. What information tell you whether there is an interaction? 1. (worth 1 point) Recall from lecture that the ANOVA parses the total variance (or all the variance present in the data) such that the noise (random variance) in the data is separated from the pattern (systematic, non-random variance) in the data. Diagram the parsing of total variance for... (Be sure to label all elements of the diagram.) a. The one-way ANOVA. b. The repeated-measures ANOVA. 2. A researcher obtained the following means using a 2 x 2 factorial design. Factor B B2 , A 20 20 Factor A A2 10 10 a. (worth 1 point) "2 x 2" tells you about the design of the study. i. How many IVs were in the study? ii. How many levels did the IVs have? b. (worth 1 point) To compare the difference between A, and A2, you must "collapse across Factor B. i. What is the mean for A, if you average across the levels of B? ii. What is the mean of Az if you average across the levels of B? c. (worth 1 point) To compare the difference between B and B2, you must "collapse" across Factor A. i. What is the mean for B, if you average across the levels of A? ii. What is the mean for B, if you average across the levels of A? d. (worth 1 point) Using the means you calculated for b and C.... i. Is there likely a main effect for Factor A? ii. Is there likely a main effect for Factor B? iii. What information tells you whether there are main effects? e. (worth 1 point) Draw a graph of the data. Let Factor B be your x-axis and Factor A to be the lines in your graph. i. Is there an interaction between Factors A and B? ii. What information tell you whether there is an interaction

Step by Step Solution

There are 3 Steps involved in it

1 Expert Approved Answer
Step: 1 Unlock blur-text-image
Question Has Been Solved by an Expert!

Get step-by-step solutions from verified subject matter experts

Step: 2 Unlock
Step: 3 Unlock

Students Have Also Explored These Related General Management Questions!