

Question
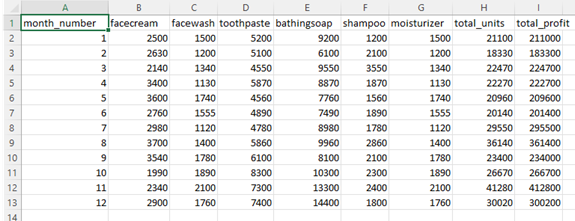
1. Write a python program that reads the company_sales_data.csv file and plot the total profit of all months using line plot. a. For the graph,
1. Write a python program that reads the company_sales_data.csv file and plot the total profit of all months using line plot.
a. For the graph, use the title Company Sales Data of Last Year, x-label=Month Number, y-label=Total Profit, and the legend for Profit data of last year to the graph.
b. Find the mean of the total profit and display on the console.
c. Find the minimum of the total profit and display on the console.
d. Find the maximum of the total profit and display on the console.
e. Find the variance of the total profit and display on the console.
f. Find the median of the total profit and display on the console.
g. Find the standard deviation of the total profit and display on the console.
Step by Step Solution
There are 3 Steps involved in it
Step: 1

Get Instant Access to Expert-Tailored Solutions
See step-by-step solutions with expert insights and AI powered tools for academic success
Step: 2

Step: 3
Ace Your Homework with AI
Get the answers you need in no time with our AI-driven, step-by-step assistance
Get Started
Relational Database And Transact SQL
Authors: Lucy Scott
1st Edition
1974679985, 978-1974679980