Question
1. Write an m-file to construct the standard normal distribution table. 2. The heights of 50 students, measured to the nearest centimetres, have been

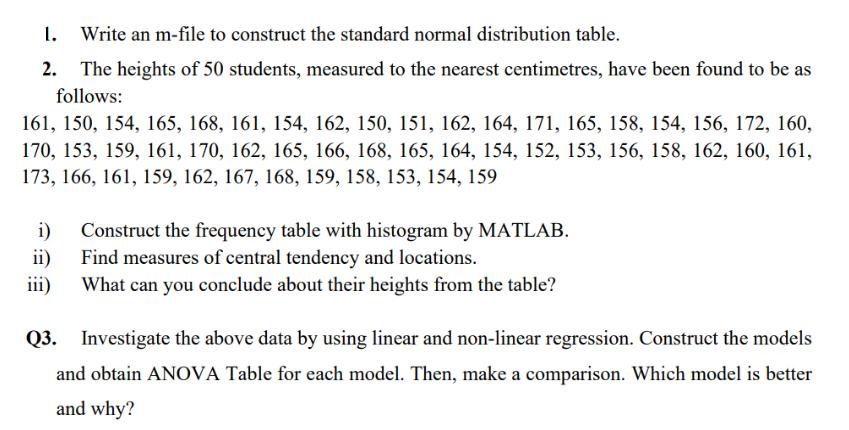
1. Write an m-file to construct the standard normal distribution table. 2. The heights of 50 students, measured to the nearest centimetres, have been found to be as follows: 161, 150, 154, 165, 168, 161, 154, 162, 150, 151, 162, 164, 171, 165, 158, 154, 156, 172, 160, 170, 153, 159, 161, 170, 162, 165, 166, 168, 165, 164, 154, 152, 153, 156, 158, 162, 160, 161, 173, 166, 161, 159, 162, 167, 168, 159, 158, 153, 154, 159 i) Construct the frequency table with histogram by MATLAB. Find measures of central tendency and locations. ii) iii) What can you conclude about their heights from the table? Q3. Investigate the above data by using linear and non-linear regression. Construct the models and obtain ANOVA Table for each model. Then, make a comparison. Which model is better and why?
Step by Step Solution
There are 3 Steps involved in it
Step: 1

Get Instant Access to Expert-Tailored Solutions
See step-by-step solutions with expert insights and AI powered tools for academic success
Step: 2

Step: 3

Ace Your Homework with AI
Get the answers you need in no time with our AI-driven, step-by-step assistance
Get StartedRecommended Textbook for
Corporate Finance
Authors: Stephen Ross, Randolph Westerfield, Jeffrey Jaffe
13th International Edition
1265533199, 978-1265533199
Students also viewed these Mathematics questions
Question
Answered: 1 week ago
Question
Answered: 1 week ago
Question
Answered: 1 week ago
Question
Answered: 1 week ago
Question
Answered: 1 week ago
Question
Answered: 1 week ago
Question
Answered: 1 week ago
Question
Answered: 1 week ago
Question
Answered: 1 week ago
Question
Answered: 1 week ago
Question
Answered: 1 week ago
Question
Answered: 1 week ago
Question
Answered: 1 week ago
Question
Answered: 1 week ago
Question
Answered: 1 week ago
Question
Answered: 1 week ago
Question
Answered: 1 week ago
Question
Answered: 1 week ago
Question
Answered: 1 week ago
Question
Answered: 1 week ago
Question
Answered: 1 week ago
Question
Answered: 1 week ago
View Answer in SolutionInn App


