Answered step by step
Verified Expert Solution
Link Copied!

Question

1 Approved Answer

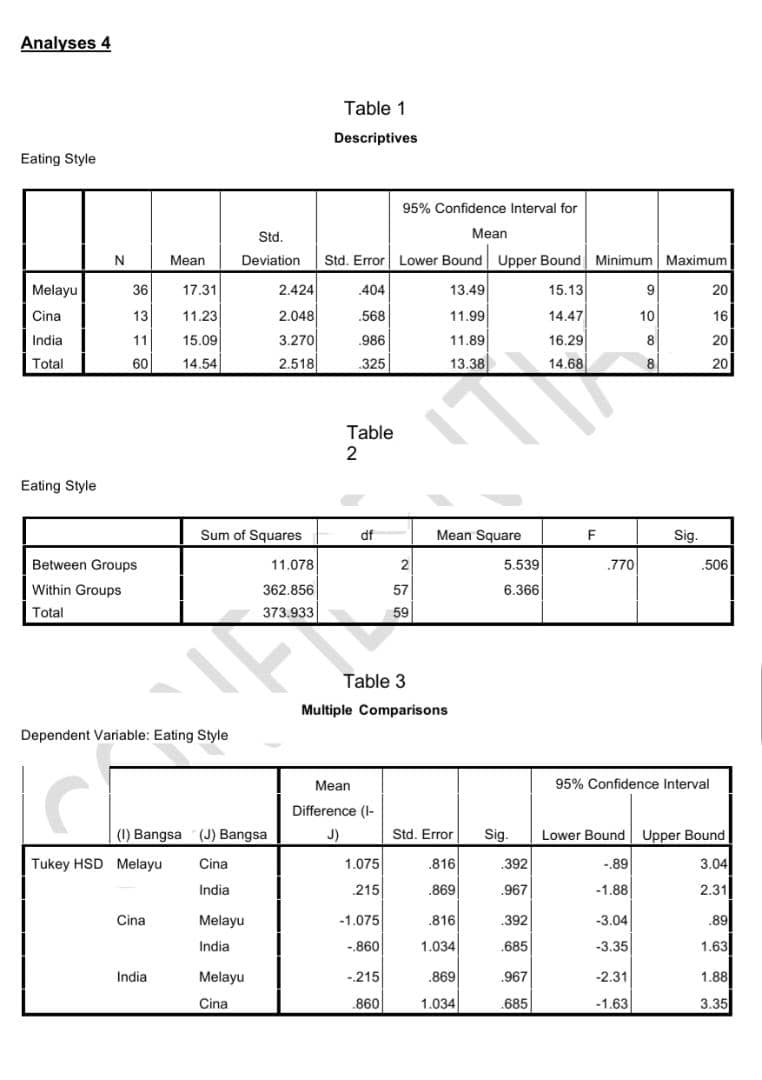
1) Write the Null Hypothesis(Ho) for each inference analysis. Analyses 4 Table 1 Descriptives Eating Style 95% Confidence Interval for Std. Mean N Mear Deviation

1)Write the Null Hypothesis(Ho) for each inference analysis.

image text in transcribedimage text in transcribedimage text in transcribedimage text in transcribed
Analyses 4 Table 1 Descriptives Eating Style 95% Confidence Interval for Std. Mean N Mear Deviation Std. Error Lower Bound Upper Bound Minimum Maximum Melayu 36 17.31 2.424 404 13.49 15.13 9 20 Cina 13 11.23 2.048 568 11.99 14.47 10 16 India 11 15.09 3.270 986 11.89 16.29 8 20 Total 60 14.54 2.518 .325 13.38 14.68 B 20 Table 2 Eating Style Sum of Squares of Mean Square F Sig. Between Groups 11.078 2 5.539 770 506 Within Groups 362.856 57 6.366 Total 373.933 59 Table 3 Multiple Comparisons Dependent Variable: Eating Style Mean 95% Confidence Interval Difference (1- (1) Bangsa (J) Bangsa JJ Std. Error Sig. Lower Bound Upper Bound Tukey HSD Melayu Cina 1.075 816 392 .89 3.04 India .215 869 .967 -1.88 2.31 Cina Melayu -1.075 .816 392 -3.04 .89 India -.860 1.034 685 -3.35 1.63 India Melayu -.215 869 .967 -2.31 1.88 Cina 860 1.034 .685 -1.63 3.35Table 4 Gaya Pemakanan /Eating Style Subset for alpha = 0.05 Bangsa N 1 Student-Newman-Keulsa.b Cina 13 13.23 India 11 14.09 Melayu 36 14.31 Sig. 470 Tukey HSDa.b Cina 13 13.23 India 11 14.09 Melayu 36 14.31 Sig. .470 Means for groups in homogeneous subsets are displayed. a. Uses Harmonic Mean Sample Size = 15.337. b. The group sizes are unequal. The harmonic mean of the group sizes is used. Type I error levels are not guaranteed.Table 3 Chi-Square Tests Value df Asymp. Sig. (2-sided) Pearson Chi-Square 5.592 2 061 Likelihood Ratio 7.441 2 024 Linear-by-Linear Association 5.498 019 N of Valid Cases 60 a. 1 cells (16.7%) have expected count less than 5. The minimum expected count is 2.10. Table 4 Symmetric Measures Value Approx. Sig Nominal by Nominal Phi 305 061 Cramer's V .305 .061 Contingency Coefficient 292 061 N of Valid Cases 60Analyses 5 Table 1 Case Processing Summary Cases Valid Missing Total N Percent N Percent N Percent Gender* Types of Favourite Food 60 100.0% 0 0.0% 60 100.0% Table 2 Gender* Types of Favourite Food Jenis makanan kegemaran Nasi Western Goreng Sandwich Food Total Gender Male Count 10 14 Expected Count 6.5 5.4 2.1 14.0 % within gender responden kajian 71.4% 28.6% 0.0% 100.0% % within Jenis 35.7% 17.4% 0.0% 23.3% makanan kegemaran Female Count 18 SL 46 Expected Count 21.5 17.6 6.9 46.0 % within Gender 39.1% 41.3% 19.6% 100.0% study respondents % within Type 64.3% 82.6% 100.0% 76.7% favourite food Total Count 28 23 60 Expected Count 28.0 23.0 9.0 60.0 % within Gender 46.7% 38.3% 15.0% 100.0% study respondents % within Type 100.0% 100.0% 100.0% 100.0% favourite food

Step by Step Solution

There are 3 Steps involved in it

Step: 1

blur-text-image

Get Instant Access to Expert-Tailored Solutions

See step-by-step solutions with expert insights and AI powered tools for academic success

Step: 2

blur-text-image

Step: 3

blur-text-image

Ace Your Homework with AI

Get the answers you need in no time with our AI-driven, step-by-step assistance

Get Started

Recommended Textbook for

Advanced Engineering Mathematics

Authors: ERWIN KREYSZIG

9th Edition

0471488852, 978-0471488859

More Books

Students also viewed these Mathematics questions