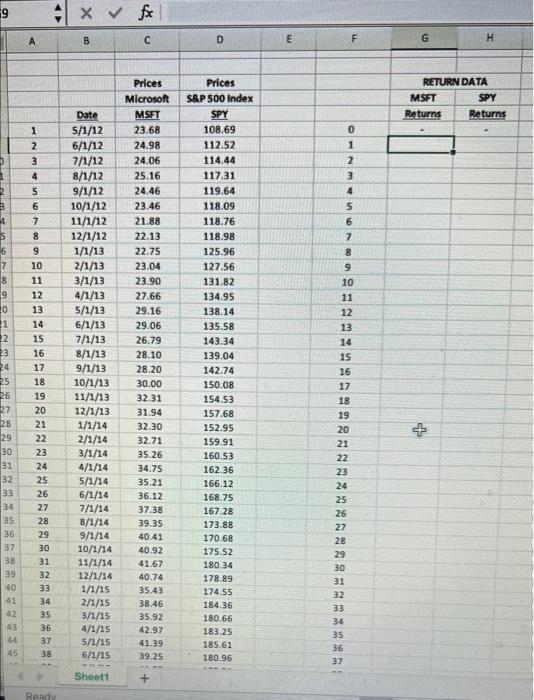
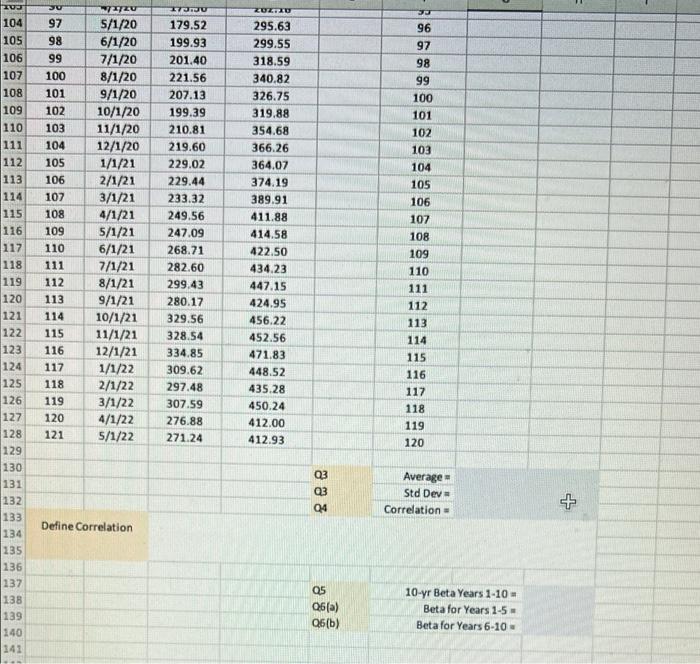
1. You are analyzing Microsoft to find an intrinsic value for Microsoft (MSFT) using the both the Constant Dividend Discount Model (DDM) and the Non-constant DDM. I have provided you with an Excel spreadsheet of 121 monthly prices from May 1, 2012 to May 1, 2022) for MSFT and S&P 500 Market Index (SPY). These prices have already been adjusted for dividends. List dates and prices out on your spreadsheet in order to calculate monthly returns. 2. Using the prices provided, calculate the monthly returns for each of the stocks, where r= (P/P1)-1; which is the same as [(P-P-1)/P] as I covered in the Lecture Video. PLEASE NOTE THAT THE DATA IS LISTED FROM May 2012 TO May 2022! SO BE CAREFUL WITH YOUR RETURN FORMULA! You may post monthly returns as decimals to 6 places or percentages to 4 places. For example, average return for MSFT can be written as 013333 or 1.3333 %. (10 points) 3. At the bottom of the column for each stock calculate the Average Monthly Return (use -AVERAGE() function) and the Standard Deviation [use STDEV.PO] population function NOT STDEV() sample function). As a check, you should find your average returns to be: MSFT- 2.2209% and SPY=1.1955%. (5 points) 4. Calculate and INTERPRET the Correlation Coefficient (p2) between MSFT and SPY. (use -CORREL() function). USE RETURNS TO FIND CORRELATION (5 points) 5. Estimate the Beta for MSFT over the 120 month period by running a Regression in Excel of MSFT returns on the y-axis (dependent variable) and SPY returns on the x-axis (independent variable). The Beta= the SLOPE of the regression....So just use the -SLOPE() function in Excel to find the Beta. Be careful use Returns NOT Prices! **How does your estimate compare to the Finance Yahoo.com beta and the Value Line beta? (10 points) 6. Now, let's check the stability of Beta. Again, use the SLOPE function in Excel, where SPY is the independent and MSFT is the dependent variable (a) Calculate Beta (-slope) on returns over the first 60 months (Retums 1-60): June 1, 2012 to May 1, 2017. (b) Calculate Beta (-slope) on returns over the second 60 months (Returns 61-120: June 1, 2017 to May 1, 2022. Comment on any differences between the 10-year vs the two 5-year Betas? (5 points) 1- 14 14 14 14 14 148 142 D 1 2 B A 5 6 7 8 9 0 1 22 23 24 25 26 27 28 29 30 31 32 33 34 35 36 37 38 39 40 41 42 43 44 45 A 12345 6 7 8 9 SRHEESSAS28222222==== 10 12 13 14 15 2/1/13 11 3/1/13 16 17 18 19 20 21 23 24 25 26 27 29 30 31 32 33 34 35 36 37 38 x fx C Ready B Date 5/1/12 6/1/12 7/1/12 8/1/12 9/1/12 10/1/12 11/1/12 12/1/12 1/1/13 4/1/13 5/1/13 6/1/13 7/1/13 8/1/13 9/1/13 10/1/13 11/1/13 12/1/13 1/1/14 2/1/14 3/1/14 4/1/14 5/1/14 6/1/14 7/1/14 8/1/14 9/1/14 10/1/14 11/1/14 12/1/14 1/1/15 2/1/15 3/1/15 4/1/15 5/1/15 6/1/15 34 3 Sheet1 Prices Microsoft MSFT 23.68 24.98 24.06 25.16 24.46 23.46 21.88 22.13 22.75 23.04 23.90 27.66 29.16 29.06 26.79 28.10 28.20 30.00 32.31 31.94 32.30 32.71 35.26 34.75 35.21 36.12 37.38 39.35 40.41 40.92 41.67 40.74 35.43 38.46 35.92 42.97 41 39.25 MUSS + D Prices S&P 500 Index SPY 108.69 112.52 114.44 117.31 119.64 118.09 118.76 118.98 125.96 127.56 131.82 134.95 138.14 135.58 143.34 139.04 142.74 150.08 154.53 157.68 152.95 159.91 160.53 162.36 166.12 168.75 167.28 173.88 170.68 175.52 180.34 178.89 174.55 184.36 180.66 183.25 185.61 180.96 E 9 10 11 2 3 4 5 6 12 13 1 7 8 14 15 S5222222222===== 0 16 17 18 24 F 26 27 29 28 33 37 G RETURN DATA MSFT Returns H + SPY Returns 20 104 105 98 106 99 107 100 108 101 109 102 110 103 111 104 112 105 113 106 114 107 115 108 116 109 117 110 118 111 119 112 120 113 121 114 122 115 123 116 124 117 125 118 126 119 127 120 121 30 97 128 129 130 131 132 133 134 135 136 137 138 139 140 141 1/3/20 173.30 5/1/20 179.52 6/1/20 199.93 7/1/20 201.40 8/1/20 221.56 9/1/20 207.13 10/1/20 199.39 11/1/20 210.81 219.60 229.02 229.44 233.32 249.56 12/1/20 1/1/21 2/1/21 3/1/21 4/1/21 5/1/21 247.09 6/1/21 268.71 7/1/21 282.60 8/1/21 299.43 9/1/21 280.17 10/1/21 329.56 11/1/21 328.54 12/1/21 334.85 1/1/22 2/1/22 3/1/22 4/1/22 5/1/22 Define Correlation 309.62 297.48 307.59 276.88 271.24 ZUZ:30 295.63 299.55 318.59 340.82 326.75 319.88 354.68 366.26 364.07 374.19 389.91 411.88 414.58 422.50 434.23 447.15 424.95 456.22 452.56 471.83 448.52 435.28 450.24 412.00 412.931 288 03 Q4 Q5 Q6(a) Q6(b) JJ 96 97 98 99 100 101 102 103 104 105 106 107 108 109 110 111 112 113 114 115 116 117 118 119 120 Average Std Dev Correlation 10-yr Beta Years 1-10 = Beta for Years 1-5 Beta for Years 6-10 +