Answered step by step
Verified Expert Solution
Link Copied!

Question

1 Approved Answer

1. You are given the following data measured during an unknown process a. We know based on this model that , how would you determine
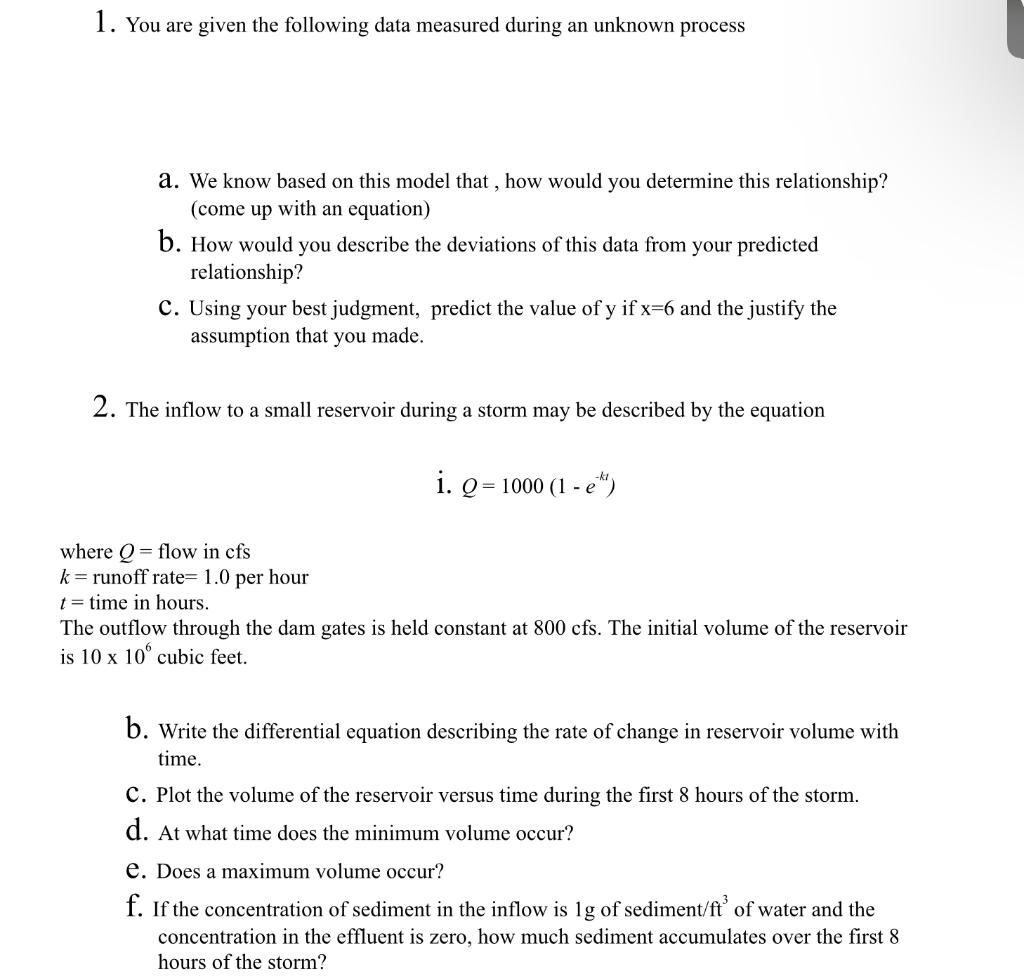
image text in transcribed

1. You are given the following data measured during an unknown process a. We know based on this model that , how would you determine this relationship? (come up with an equation) b. How would you describe the deviations of this data from your predicted relationship? c. Using your best judgment, predict the value of y if x=6 and the justify the assumption that you made. 2. The inflow to a small reservoir during a storm may be described by the equation i. Q 2 = 1000 (1 - 2") where Q = flow in cfs k= runoff rate= 1.0 per hour t = time in hours. The outflow through the dam gates is held constant at 800 cfs. The initial volume of the reservoir is 10 x 10 cubic feet. b. Write the differential equation describing the rate of change in reservoir volume with time. C. Plot the volume of the reservoir versus time during the first 8 hours of the storm. d. At what time does the minimum volume occur? e. Does a maximum volume occur? f. If the concentration of sediment in the inflow is Ig of sediment/ft of water and the concentration in the effluent is zero, how much sediment accumulates over the first 8 hours of the storm

Step by Step Solution

There are 3 Steps involved in it

Step: 1

blur-text-image

Get Instant Access to Expert-Tailored Solutions

See step-by-step solutions with expert insights and AI powered tools for academic success

Step: 2

blur-text-image

Step: 3

blur-text-image

Ace Your Homework with AI

Get the answers you need in no time with our AI-driven, step-by-step assistance

Get Started

Recommended Textbook for

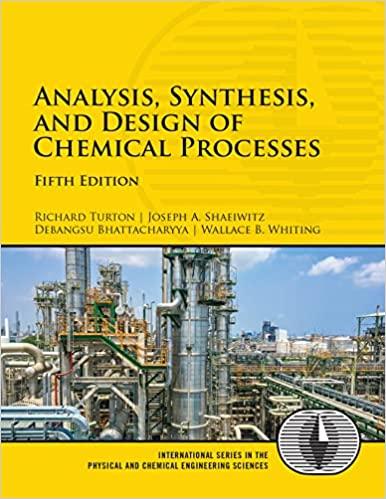
Analysis Synthesis And Design Of Chemical Processes

Authors: Richard Turton, Joseph Shaeiwitz, Debangsu Bhattacharyya, Wallace Whiting

5th Edition

0134177401, 978-0134177403

More Books

Students also viewed these Chemical Engineering questions