

Question
1. you can assume RTT measurements are independent and Gaussian distributed. 2. You do not need to run your experiment in the simulation mode. You
1. you can assume RTT measurements are independent and Gaussian distributed.
2. You do not need to run your experiment in the simulation mode. You just need to uncheck the constant delay box in the simulation mode and then go back to the realtime mode to run your experiment. The simulation mode is for one to step through the network status change, which is not necessary for this project. Running your experiment in realtime mode is actually more time efficient and easy to setup.
Network Simulation using CISCO Packet Tracer
Simulation Setting
In this homework, you are required to setup a network in Packet Tracer as the follows topology.
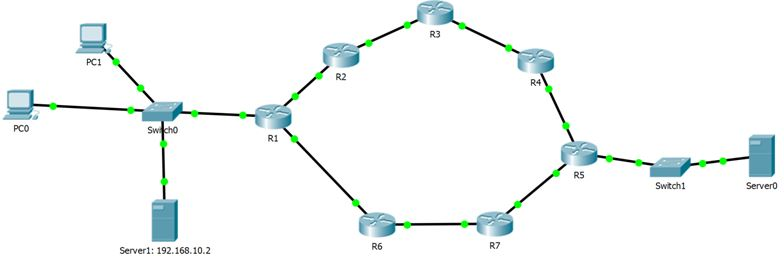
Server 1, PC0 and PC1 connect to Switch0 through FastEthernet interfaces. Server0 connects to switch 1 through FastEthernet interface. All other links are between GigabitEthernet interfaces.
Server1 provide DNS service for its local network. Server 0 has a host name of test.com. Server1 should have a DNS record for Server0 that maps test.com to Server0s IP address.
PC1 runs a client side application that sends packets to a server process running on Server0s UDP port 1432.
Experiment 1:
Uncheck the constant delay checkbox on the simulation mode of Packet Tracer.
PC1s client application sends Server0 a packet of 1024 Bytes per second. Run Ping on PC0 to ping test.com for 20 times and record the RTT time. Based on the recorded results, show the average and the 95% confidence interval of your measured RTT time.
Hint: You will probably need to program your own client and server application to run on PC1 and Server0. You can use the UDP templates in Packet Tracer as a starting point.
Experiment 2:
Modify PC1s client application so that it sends Server0 a packet of 1024 Bytes for every 1 ms. PC0s client application and every other settings remain the same. Run Ping on PC0 to ping test.com for 20 times and record the RTT time. Based on the recorded results, show the average and the 95% confidence interval of your measured RTT time.
Question:
Are there differences in the RTT measurements in the above two experiment settings? Can you explain why there are differences?
What to Submit:
The two .pkt files of your first experiment and second experiment.
The recorded 20 RTTs, the average RTT and the RTTs 95% confidence interval of the first and second experiments.
Answer to the final question.
Submit all of the above as a single .zip file.
R3 PC1 R2 R4 PCO Sw R1 R5 Switch1 Servero R6 R7 Server1: 192.168.10.2 R3 PC1 R2 R4 PCO Sw R1 R5 Switch1 Servero R6 R7 Server1: 192.168.10.2Step by Step Solution
There are 3 Steps involved in it
Step: 1

Get Instant Access to Expert-Tailored Solutions
See step-by-step solutions with expert insights and AI powered tools for academic success
Step: 2

Step: 3
Ace Your Homework with AI
Get the answers you need in no time with our AI-driven, step-by-step assistance
Get Started
SQL Server 2019 Administrator S Guide A Definitive Guide For DBAs To Implement Monitor And Maintain Enterprise Database Solutions
Authors: Marek Chmel ,Vladimir Muzny
2nd Edition
1789954320, 978-1789954326