Answered step by step
Verified Expert Solution
Question
1 Approved Answer
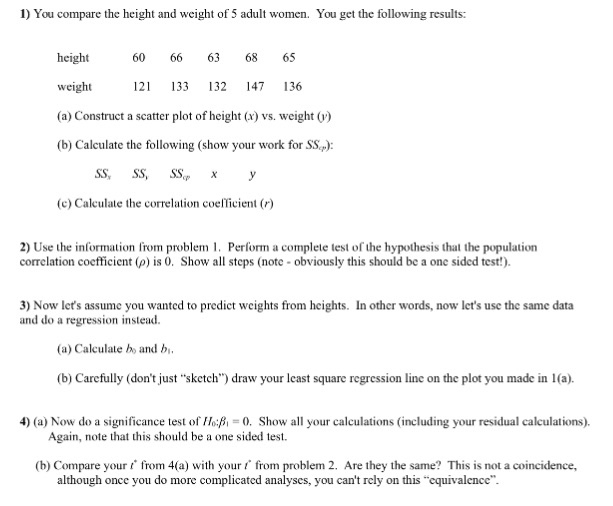
1) You compare the height and weight of 5 adult women. You get the following results: height 60 weight 121 133 132 147 136

1) You compare the height and weight of 5 adult women. You get the following results: height 60 weight 121 133 132 147 136 (a) Construct a scatter plot of height (x) vs. weight (v) (b) Calculate the following (show your work for SS): SS SS SS (c) Calculate the correlation coefficient (r) 66 63 X 68 65 y 2) Use the information from problem 1. Perform a complete test of the hypothesis that the population correlation coefficient (p) is 0. Show all steps (note - obviously this should be a one sided test!). 3) Now let's assume you wanted to predict weights from heights. In other words, now let's use the same data and do a regression instead. (a) Calculate bo and b. (b) Carefully (don't just "sketch") draw your least square regression line on the plot you made in 1(a). 4) (a) Now do a significance test of He: = 0. Show all your calculations (including your residual calculations). Again, note that this should be a one sided test. (b) Compare your from 4(a) with your f' from problem 2. Are they the same? This is not a coincidence, although once you do more complicated analyses, you can't rely on this "equivalence".
Step by Step Solution
★★★★★
3.47 Rating (167 Votes )
There are 3 Steps involved in it
Step: 1
To answer your questions lets go through each one step by step 1 Scatter plot of height vs weight To construct a scatter plot well plot the height values on the xaxis and the weight values on the yaxi...
Get Instant Access to Expert-Tailored Solutions
See step-by-step solutions with expert insights and AI powered tools for academic success
Step: 2

Step: 3

Ace Your Homework with AI
Get the answers you need in no time with our AI-driven, step-by-step assistance
Get Started


